Contents
- Cell select analysis
- load the file info to variable in workspace
- Load Parameters
- load file to variable in workspace
- scaling image from 0-255
- Display Scaled Images 1st and nth
- Create bw mask from scaled image
- Plot frames 1-20 of BWmaskclean
- If skipping the shift correction set an array Icellsx as the
- Perform Image shift Adjustment by Crosscorrelation
- Plot the Background Fluorescence Intensity (scaled with bar) and publish
- Select single/isolated cells of interest from an
- Track cells by using centroids of in the first frame
- Create an array of cell coordinates for printing cell names
- Correct the cell selection bwconncomp, error in selecting cells that
- Display each frame with cells of interest tagged by colors
- Get Restricted cell area intensities
- Compute Descriptive Statistics for each cell
- Make a color index to color cells
- Make a character string of numbers for all cells
- Make marker symbol lookup table
- Display and publish the 1st and last image (in original intensity)
- Plot Intensity vs Time for each cell and publish
- Plot Intensity vs Time(frame) and publish
- Plot a Curve Fit to response after treatment
- Save Variables
- Plot Radialwise Intensity and publish
- Save Variables
- Make Avi Movie of original images and Mean +/- SD Inensity of Cell Selection
Cell select analysis
back to top%--------------------------------------------------- %cd('C:\XXX')% where XXX = your file path to image data %---------------------------------------------------
load the file info to variable in workspace
back to top%--------------------------------------------------- %files: % 'B8_treatment_0,1_M_f-14_(GFP,0,2Hz,180f).tif' % 'C8 psychosinie 5,0 M_f-12_(GFP, 0.2Hz, 180f).tif' % 'D8 vehicle_f-12_(GFP, 0.2Hz, 180f).tif' % 'T3-A04_5uM psychosine_40_(GFP, 0.1Hz, 80).tif' %--------------------------------------------------- %Trial 30_05/11/12 %file = 'B2 f-12 treatment XuM H2O (conditions).tif'; %where B2=well number, %f-12=treatment frame, XuM=concentration of tretment, conditions=treatment conditions file = 'B2 f-12 treatment XuM H2O (conditions).tif'; %---------------------------------------------------
Load Parameters
back to top%--------------------------------------------------- %CellArea = 'WholeCell'; %final area may not equal initial area CellArea = 'Restricted'; %final area equals initial area Treatment = file(1:strfind(file,'.tif')-1); %remove .tif from file names if ~isempty(strfind(Treatment,'frame')) %find frame treat when frame notation used FrameTreat = Treatment(strfind(Treatment,'frame')+6:strfind(Treatment,'frame')+7); FrameTreat = str2double(FrameTreat); elseif ~isempty(strfind(Treatment,'f-')) %find frame treat when f- notation used FrameTreat = Treatment(strfind(Treatment,'f-')+2:strfind(Treatment,'f-')+3); FrameTreat = str2double(FrameTreat); elseif ~isempty(strfind(Treatment,'no treatment')) %find if no treatment FrameTreat = 0; else FrameTreat = 0; %assume not treated end FrameRate = ' (0.2 Hz)'; %0.2Hz = 1frame/5seconds %FrameRate = ' (0.1 Hz)'; SampleFreq = 0.2; %sample rate Hz TimeTreat = roundn(FrameTreat/SampleFreq/60,-1); %minute integer FramePostTreat = FrameTreat + 1; Printcolor = 'BW'; %color of plots and figures %Printcolor = 'Color'; %will print graphs in color AxisFont = 20; Itemp = imread(file); %read first frame width = size(Itemp,2); height = size(Itemp,1); clear Itemp; info = imfinfo(file); %load info of series frames = length(info); %frames = 30; %set frames to process less than all frames clear info; Well = strtok(file); %well on plate Passage = 'P-29'; %cell passage number MyDate = '2012-05-11'; %date of experiment %FLuoXunits = 'frame'; FluoXunits = 'minutes'; FluoYLim = [0 255]; %set the fluo y-axis limits FluoYTick = [0; 50; 100; 150; 200; 250]; %make standard fluo y-axis FluoYTickS = num2str(FluoYTick); %make standard fluo y-axis char FluoXt = frames/SampleFreq; %seconds FluoXt = FluoXt/60; %minutes FluoXdiv = floor(FluoXt/5); %integer space between 5 ticks min Min2Frame = FluoXdiv*60*SampleFreq; %space between 5 ticks frames FluoXLim = [1-5 frames+5]; %set the fluo x-axis limits FluoXTick = [1; 1*Min2Frame; 2*Min2Frame;... 3*Min2Frame; 4*Min2Frame; 5*Min2Frame]; %standard fluo x-axis FluoXTickS = num2str([0; 1*FluoXdiv; 2*FluoXdiv;... 3*FluoXdiv; 4*FluoXdiv; 5*FluoXdiv]); %standard fluo x-axis char %Focus = 'Foocus: 10x'; %focus on microscope %Focus = 'Focus: 20x'; Focus = 'Foxus: 40x'; if strcmp(Focus,'Focus: 10x') %pixel to distance conversion pixeldist = '3 Pixels ~ 2um'; elseif strcmp(Focus,'Focus: 20x') pixeldist = '3 Pixels ~ 1um'; else %strcmp(Focus, 'Focus: 40x') pixeldist = '3 Pixels ~ 0.5um'; end %-------------------------------------------------- %%Determine if need to do shift correction %--------------------------------------------------- shiftCorrection = 'Yes'; %shiftCorrection = 'No'; %---------------------------------------------------
load file to variable in workspace
back to top%--------------------------------------------------- I = ones(height,width,frames,'uint8'); %preallocate for k = 1:frames; I(:,:,k) = imread(file,'index',k); end clear width height %---------------------------------------------------
scaling image from 0-255
back to top%--------------------------------------------------- %(01/11/12)-need to create array for storing scaled images (double, uint8) % I1 = I(:,:,1); % I1sc = double(I1); %store to array % I1sc = I1sc - min(min(I1sc)); % I1sc = I1sc * 256/(max(max(I1sc))); % I1sc = uint8(I1sc); %store to array Isc = zeros(size(I),'uint8'); Iscd = double(Isc(:,:,1)); for k = 1:frames; Iscd(:,:,1) = double(I(:,:,k)) - min(min(double(I(:,:,k)))); Isc(:,:,k) = uint8(Iscd * 256 / (max(Iscd(:)))); end clear Iscd; %---------------------------------------------------
Display Scaled Images 1st and nth
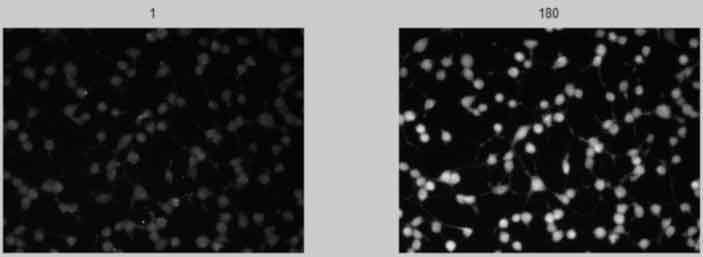
back to top
%---------------------------------------------------
% figure;
% subplot(1,2,1), imshow(Isc(:,:,1)),title(num2str(1));
% subplot(1,2,2),imshow(Isc(:,:,frames)),title(num2str(frames));
%---------------------------------------------------
Create bw mask from scaled image
back to top%--------------------------------------------------- % level = graythresh(I1sc); % BWI1sc = im2bw(I1sc,level); % figure,imshow(BWI1sc) % %(01/11/12)-need to create array for storing BWIclean images % BWI1clean = bwareaopen(BWI1sc,280); % se = strel('disk',3); % BWI1clean2 = imclose(BWI1clean,se); %store to array BWIclean = logical(I); %preallocate array se = strel('disk',3); %create shifting filter disk for k = 1:frames; if k <=FrameTreat level = 0.75*graythresh(Isc(:,:,k)); %variable percent thresh else level = 0.75*graythresh(Isc(:,:,k)); %75 percent thresh end BWIsc = im2bw(Isc(:,:,k),level); BackgI(:,:,k) = uint8(I(:,:,k)).*uint8(~(BWIsc)); %show background of image BWIclean0 = bwareaopen(BWIsc,200); %delete small objects BWIclean(:,:,k) = imclose(BWIclean0,se); %get rid of pepper in objects end clear Isc level BWIsc BWIclean0 se ; %--------------------------------------------------
Plot frames 1-20 of BWmaskclean
back to top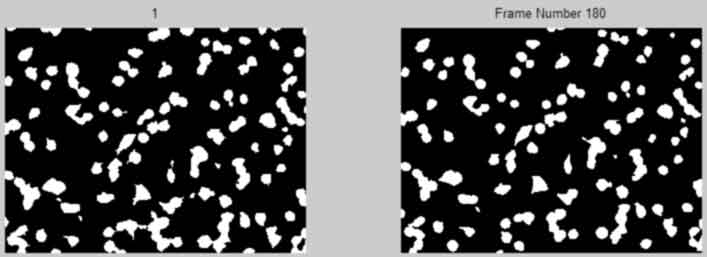
%---------------------------------------------------
% figure;
% subplot(1,2,1), imshow(BWIclean(:,:,1)),title(num2str(1));
% subplot(1,2,2),imshow(BWIclean(:,:,frames)),title(num2str(frames));
%
% for k = 1:20;
%     figure(1),imshow(BWIclean(:,:,k))
%     title({['Frame Number ', num2str(k)]});
%     pause(2);
% end
%---------------------------------------------------
If skipping the shift correction set an array Icellsx as the
back to topmask multiplied by the original images. Perform all data analysis using Icellsx, for original intensity values.
%---------------------------------------------------
if strcmp(shiftCorrection,'No')
    Icellsx = uint8(double(BWIclean).*double(I));
    clear I BWIclean
end
%---------------------------------------------------
Perform Image shift Adjustment by Crosscorrelation
back to top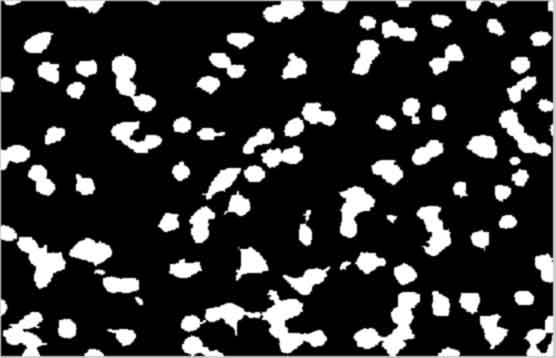
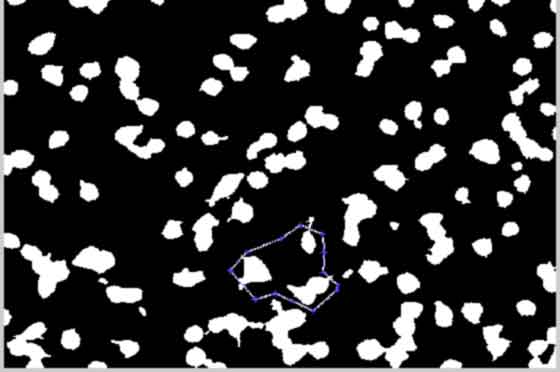
select cell(s) of interest for registering shift correction Only need to do once on first(might need to adjust later) image for stack of images
%---------------------------------------------------
if strcmp(shiftCorrection,'Yes')
    [BWIroiI1,xi,yi] = roipoly(double(BWIclean(:,:,1))); %return subroi
    xi = ceil(xi);
    yi = ceil(yi);
    roiymin = max( [ (min(yi))-125, 1 ] );
    roixmin = max( [ (min(xi))-125, 1 ] );
    roiymax = min( [ (max(yi))+125, size(BWIroiI1,1) ] );
    roixmax = min( [ (max(xi))+125, size(BWIroiI1,2) ] );
    %BWroiI1b = BWI1clean2(roiymin:roiymax, roixmin:roixmax); %larger roi
    A = BWIclean(:,:,1);
    A = A(min(yi):max(yi),min(xi):max(xi));
    B = BWIroiI1(min(yi):max(yi),min(xi):max(xi));
    C = A.*B;
    BWItemplate = C; %create and store template for shift registration
    clear xi yi A B C BWIroiI1
    close(gcf)
    % figure;
    % imshow(BWItemplate);
    %--------------------------------------------------
    %%Compute the offset between image 1 BWtemplate and image n
    %--------------------------------------------------
    BWIroiI = BWIclean(uint16(roiymin:roiymax), uint16(roixmin:roixmax),:);
    ypeak = ones(1,frames);
    xpeak = ypeak;
    corr_offset = ones(1,2,frames);
    offset = corr_offset;
    for k = 1:frames;
    % BWroitemp = BWIclean2(:,:,k);
    % BWroiI(:,:,k) = BWroitemp(roiymin:roiymax, roixmin:roixmax); %larger roi
    cc = normxcorr2(BWItemplate, double(BWIroiI(:,:,k)));
    [max_cc, imax] = max(abs(cc(:)));
    [ypeak(k), xpeak(k)] = ind2sub(size(cc),imax(1));
    corr_offset(1,:,k) = [ypeak(k)-size(BWItemplate,1),...
        xpeak(k)-size(BWItemplate,2)];
    %Calculate the offset with respect to first image
    offset(1,:,k) = corr_offset(1,:,k) - corr_offset(1,:,1); %store to array
    end
    clear BWIroiI BWItemplate xpeak ypeak corr_offset max_cc imax
    clear roiymin roiymax roixmin roixmax
    %--------------------------------------------------
    %%Offset cropping for all images with respect to image one
    %--------------------------------------------------
    upy =  min(offset(1,1,:));%max shift up (-y) from 2D image shift correlation
    dny = max(offset(1,1,:));%get max shift down (+y) from 2D image shift correlation
    lftx = min(offset(1,2,:));%get max shift left (-x) from 2D image shift correlation
    rgtx = max(offset(1,2,:));%get max shift right (+x) from 2D image shift correlation
    if upy < 0 %trim the top of canvas
        yminC = 1 - upy;
    else %no trim
        yminC = 1;
    end

    if dny > 0 %trim the bottom of canvas
        ymaxC = size(I(:,:,1),1) - dny;
    else %no trim
        ymaxC = size(I(:,:,1),1);
    end

    if lftx < 0 %trim the left of canvas
        xminC = 1 - lftx;
    else %no trim
        xminC = 1;
    end

    if rgtx > 0 %trim the right of canvas
        xmaxC = size(I(:,:,1),2) - rgtx;
    else %no trim
        xmaxC = size(I(:,:,1),2);
    end

    %--------------------------------------------------
    % %shift correction for image n versus image 1
    %--------------------------------------------------
    for k = 1:frames;
    Isctemp = uint8(double(BWIclean(:,:,k)).*double(I(:,:,k)));
    offset2 = offset(1,:,k);
    Icellsx(:,:,k) = Isctemp( (yminC:ymaxC)+offset2(1),...
        (xminC:xmaxC)+offset2(2));
    end
    clear cc Isctemp offset offset1 offset2 dny upy lftx rgtx
    %need to limit to +1 and max length or width
    clear I BWIclean;
end
%---------------------------------------------------
Plot the Background Fluorescence Intensity (scaled with bar) and publish
back to top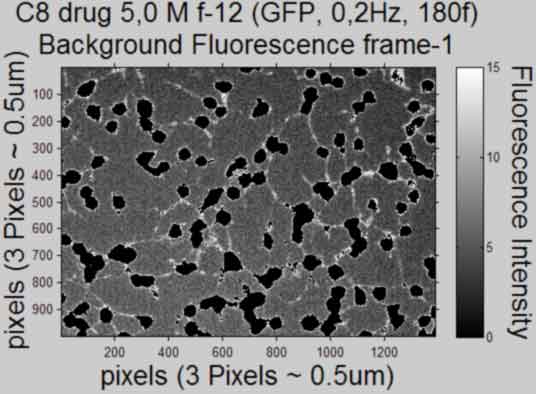
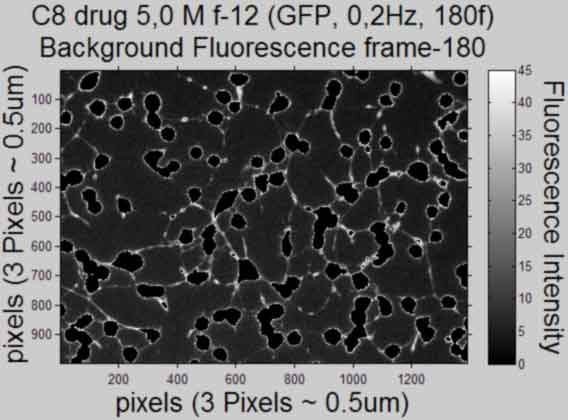
%---------------------------------------------------
for k = [1,frames]
    figure;
    if strcmp(shiftCorrection,'Yes')
        imshow(BackgI(yminC:ymaxC,xminC:xmaxC,k),'DisplayRange',...
            [min(min((BackgI(:,:,k)))),max(max((BackgI(:,:,k))))],...
            'InitialMagnification', 25,'Border', 'loose'), axis on %do not scale 8bit map
    else
        imshow(BackgI(:,:,k), 'DisplayRange',...
            [min(min((BackgI(:,:,k)))),max(max((BackgI(:,:,k))))],...
        'InitialMagnification', 25, 'Border', 'loose'), axis on %do not scale 8bit map
    end
    %imagesc(BackgI(yminC:ymaxC,xminC:xmaxC,k)), colormap gray %scaled 8bit
    %map
    set(gca,'FontSize',10)
    title({Treatment;...
        ['Background Fluorescence frame','-',num2str(k)]},'FontSize',AxisFont)
    xlabel(['pixels',' (',pixeldist,')'],'FontSize',AxisFont)
    ylabel(['pixels',' (',pixeldist,')'],'FontSize',AxisFont,...
        'VerticalAlignment','baseline')
    hcfig = colorbar; %create colorbar and get handle
    set(hcfig,'FontSize', 10)
    cTYfig = 'Fluorescence Intensity';
    hcTYfig = get(hcfig,'YLabel'); %get colorbar Yaxis title handle
    set(hcTYfig,'String',cTYfig,'Rotation',270,...
    'VerticalAlignment','bottom','FontSize',AxisFont) %insert string
    %save figure
    saveas(gcf, [Treatment, ' Background', ' Frame ', num2str(k),...
        '.pdf'], 'pdf');
    close gcf
end
clear yminC ymaxC xminC xmaxC BackgI
%---------------------------------------------------
Select single/isolated cells of interest from an
back to top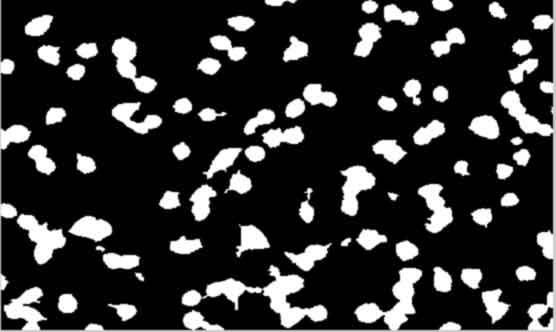
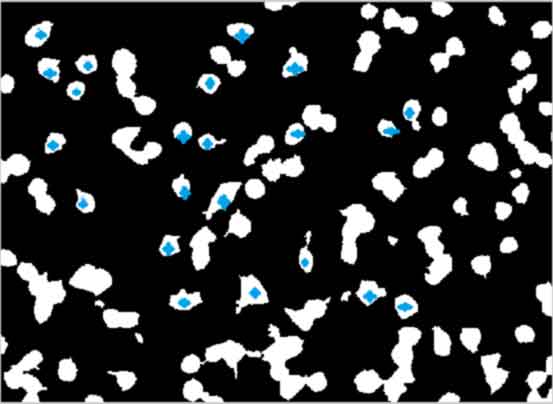
image mask of original image, for analysis
%---------------------------------------------------
k=1;
BW2(:,:,k) = bwselect(double(Icellsx(:,:,k)));
cc = bwconncomp(BW2(:,:,k));
STATS = regionprops(cc,(Icellsx(:,:,k)), 'BoundingBox',...
    'Centroid', 'Extrema', 'PixelList', 'PixelValues','Image');
%%centroid = center of cell mass
%%extrema = coordinates of cell corners
%%pixelvalues = pixel intensities
if strcmp(Printcolor,'Color')
    L(:,:,k) = labelmatrix(cc);
    RGB(:,:,:,k) = label2rgb(L(:,:,k));
end
objects = cc.NumObjects;
%RGB(:,:,:,k) = label2rgb(L(:,:,k),'Lines','k'); %alternate colormap
close(gcf)
%---------------------------------------------------
Track cells by using centroids of in the first frame
back to topFind same cells in all frames. Assuming the cells are not moving/migrating more than a half length of a cell beween sequential images
%---------------------------------------------------
try %attempt to find cell with given centroid else change centroid
    for k = 2:frames
        centroids = cat(1,STATS(:,k-1).Centroid); %use k-1 centroid to find
        %kth cell
        %centroids = cat(1,STATS(:,1).Centroid); %use 1st centroid to find kth cell
        r = centroids(:,2); %y
        c = centroids(:,1); %x
        BW2 = bwselect(Icellsx(:,:,k),c,r);
        cc = bwconncomp(BW2);
        STATS(:,k) = regionprops(cc, (Icellsx(:,:,k)),...
            'BoundingBox', 'Centroid', 'Extrema',...
            'PixelList', 'PixelValues','Image');
        if strcmp(Printcolor,'Color')
            L(:,:,k) = labelmatrix(cc);
            RGB(:,:,:,k) = label2rgb(L(:,:,k));
            %RGB(:,:,:,k) = label2rgb(L(:,:,k),'Lines', 'k');
        end
    end
    clear BW2 centroids r c cc
catch err
    if strcmp(err.identifier,'MATLAB:badsubscript')
        try
            for k = 2:frames
                %centroids = cat(1,STATS(:,k-1).Centroid); %use k-1 centroid to find
                %kth cell
                centroids = cat(1,STATS(:,1).Centroid); %use 1st centroid to find kth cell
                r = centroids(:,2); %y
                c = centroids(:,1); %x
                BW2 = bwselect(Icellsx(:,:,k),c,r);
                cc = bwconncomp(BW2);
                STATS(:,k) = regionprops(cc, (Icellsx(:,:,k)),...
                    'BoundingBox', 'Centroid', 'Extrema',...
                    'PixelList', 'PixelValues','Image');
                if strcmp(Printcolor,'Color')
                    L(:,:,k) = labelmatrix(cc);
                    RGB(:,:,:,k) = label2rgb(L(:,:,k));
                    %RGB(:,:,:,k) = label2rgb(L(:,:,k),'Lines', 'k');
                end
            end
            clear BW2 centroids r c cc
        catch err2
            rethrow(err)
        end
    else
        rethrow(err); %if any other error stop
    end
end
%if error mismatch index dimension compare k-1 and k-2
%---------------------------------------------------
Correct the cell selection bwconncomp, error in selecting cells that
back to topshift between consecutive frames 07-5-12
%---------------------------------------------------
SwapObjects = zeros(objects,1); %initialize the swap object array
for i=1:objects;
    cent1 = STATS(i,1).Centroid; %get the first frame selection centroid
    n=1;
    for k=1:frames;
        cent2 = STATS(i,k).Centroid;
        d = sqrt((cent1(1)-cent2(1))^2 + (cent1(2)-cent2(2))^2);
        if d > 45 %arbitrary threshold if exceeds then centroid switched
            SwapObjects(i,n) = k; %store error condition frames for objects
            n = n+1;
        end
    end
end
%%Swap the flagged Objects
SwapObjects_1 = ceil(mean(SwapObjects,2)/frames); %make binary array of flaged objects
if sum(SwapObjects_1) == 2; %case for when only two objects are swapping
    n = 1;
    for k = 1:length(SwapObjects_1) %step through binary array
        if SwapObjects_1(k) == 1
            TwoObjects(n) = k; %get the object indices
            n = n+1;
        end
    end
    for k = SwapObjects(TwoObjects(1),:);
        TwoObjects_1 = STATS(TwoObjects(1),k); %temp store STATS object 1
        TwoObjects_2 = STATS(TwoObjects(2),k); %temp store STATS object 2
        STATS(TwoObjects(1),k) = TwoObjects_2; %switch STATS object 1
        STATS(TwoObjects(2),k) = TwoObjects_1; %switch STATS object 2
    end
else if sum(SwapObjects_1) > 2; %case for when 2+ objects are switching
        for k = 1:size(SwapObjects,2) %step through the columns
            for i = 1:size(SwapObjects,1) %step through the rows
                if SwapObjects(i,k) > 0
                    cent1 = STATS(i,1).Centroid; %get the objects 1st centroid
                    %d_temp(1) = sqrt( (
                    n=1;
                    for j = 1:objects;
                        cent2 = STATS(j,SwapObjects(i,k)).Centroid; %variable, flagged frame object
                        D(n) = sqrt( (cent1(1)-cent2(1))^2 + (cent1(2)-cent2(2))^2 );
                        n = n+1;
                    end
                    [~,minObject] = min(D); %get object index
                    Objects_1 = STATS(i,SwapObjects(i,k)); %temp stats flagged object
                    Objects_2 = STATS(minObject,SwapObjects(i,k)); %temp stats minD object
                    STATS(i,SwapObjects(i,k)) = Objects_2; %switch flagged object with minD object
                    STATS(minObject,SwapObjects(i,k)) = Objects_1; %switch minD object with flagged object
                end
            end
        end
    end
end
%---------------------------------------------------
Create an array of cell coordinates for printing cell names
back to topnext to cells (Extrema(2,:) = [x y] of top right corner)
%---------------------------------------------------
% pos = ones(objects,2,frames);
% for k = 1:frames
%     for i = 1:objects
%         pos(i,:,k) = STATS(i,k).Extrema(2,:); %pos[x y]
%     end
% end
%---------------------------------------------------
Display each frame with cells of interest tagged by colors
back to top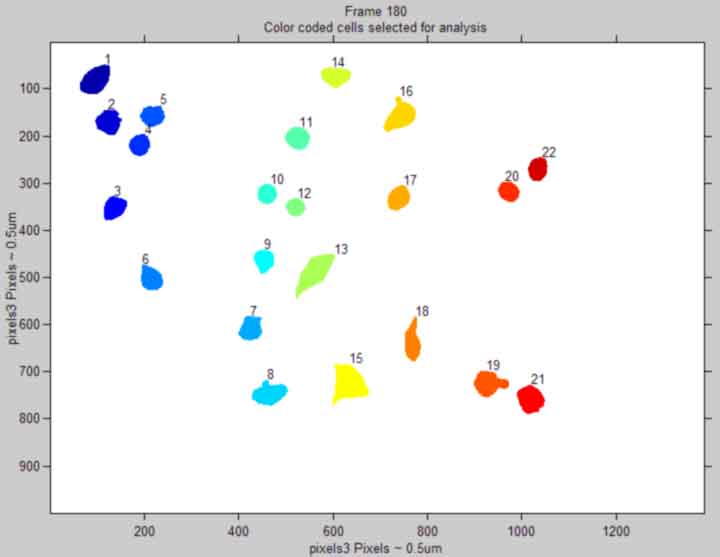
%---------------------------------------------------
% for k = 1:1
%     imshow(RGB(:,:,:,k),'InitialMagnification', 25,...
%         'Border', 'loose'),title({['Frame ', num2str(k)];...
%         'Color coded cells selected for analysis'})
%     axis on
%     xlabel(['pixels',pixeldist])
%     ylabel(['pixels',pixeldist],'VerticalAlignment','middle')
%     for i = 1:objects
%       text(floor(pos(i,1,k)), ceil(pos(i,2,k)), num2str(i),...
%       'HorizontalAlignment', 'left',...
%       'VerticalAlignment', 'baseline');
%     end
%     pause(0.3)
% end
% close(gcf)
%---------------------------------------------------
Get Restricted cell area intensities
back to top%attempt to correct for inequal cell cropping as image contrast changes %--------------------------------------------------- for i = 1:objects for k = 1:frames Areas(i,k) = length(STATS(i,k).PixelList); %store object areas at each frame end [Sarea(i) PosSa(i)] = min(Areas(i,:)); %store smallest area size and frame for each object end Template = zeros(700); for i = 1:objects Ismall = STATS(i,PosSa(i)).Image; %smallest object image uLsmall = floor(STATS(i,PosSa(i)).BoundingBox(1:2)); %smallest image uL corner for k = 1:frames uLcurrent = floor(STATS(i,k).BoundingBox(1:2)); %current uL corner Ishift = uLsmall -uLcurrent; %determine if any difference in position of uL corners Icurrent = STATS(i,k).Image; %current object image IcurrentTemplate = Template; IcurrentTemplate(300: 300 +size(Icurrent,1) -1,... 300: 300 +size(Icurrent,2) -1) = Icurrent; %place the current object image on template IsmallTemplate = Template; IsmallTemplate(300 +Ishift: 300 +(size(Ismall,1) -1 +Ishift),... 300 +Ishift: 300 + (size(Ismall,2) -1 +Ishift)) = Ismall; Ioverlay = IcurrentTemplate.*IsmallTemplate; %compute the logical operation && Overlayidx = find(Ioverlay == 1); %find linear indices of active pixels [Irow Icol] = ind2sub(size(Ioverlay),Overlayidx); %convert linear indeces to image coordinates Irow = Irow -(300 -1); %correct for the offset placement onto the template Icol = Icol -(300 -1); %correct for the offset placement onto the template Irow = Irow +uLcurrent(2); %correct for the offset of object on original image Icol = Icol +uLcurrent(1); %correct for the offset of object on original image Overlayidx = sub2ind(size(Icellsx(:,:,k)),Irow,Icol); %get linear indices of original object embedded in original image Iorig = Icellsx(:,:,k); STATS(i,k).MyPixelValues = Iorig(Overlayidx); end end %---------------------------------------------------
Compute Descriptive Statistics for each cell
back to topArea Mean Intensity Max Intensity Standard Error of the Mean
%---------------------------------------------------
for k = 1:frames
    PixInt = [];
    for i = 1:objects
        if strcmp(CellArea,'WholeCell')
            pixInt = double(STATS(i,k).PixelValues);
        else
            pixInt = double(STATS(i,k).MyPixelValues);
        end
        areaInt(i,1,k) = length(pixInt);
        meanInt(i,1,k) = mean(pixInt);
        maxInt(i,1,k) = max(pixInt);
        semInt(i,1,k) = std(pixInt)/sqrt(length(pixInt));
        PixInt = cat(1,PixInt,pixInt);
    end
    MeanInt(k) = mean(PixInt); %compute the mean intensity for frame
    StdInt(k) = std(PixInt); %compute the std for frame
    SemInt(k) = std(PixInt)/sqrt(length(PixInt)); %compute the SEM for frame
end
clear pixInt PixInt;
%
%%Find outliers, use function
%
if FrameTreat == 0;
    ObjectOut = zeros(1,objects); %fix later. Do not find outliers
else
    [ObjectOut Alphas Taus] = myout3(meanInt,FrameTreat);
end
%
%%Compute new MeanInt,StdInt,SemInt
%
if ~isempty(find(ObjectOut,1))%compute if outliers found
    for k = 1:frames
        PixInt = [];
        for i = 1:objects
            if strcmp(CellArea,'WholeCell') %use whole cell fluorescence
                pixInt = double(STATS(i,k).PixelValues);
            else
                pixInt = double(STATS(i,k).MyPixelValues); %use area select fluorescence
            end
            if ~ObjectOut(i) %if object out is not true concatenate the array
                PixInt = cat(1,PixInt,pixInt);
            end
        end
        MeanIntadj(k) = mean(PixInt);
        StdIntadj(k) = std(PixInt);
        SemIntadj(k) = std(PixInt)/sqrt(length(PixInt));
    end
    clear pixInt PixInt;
else
    MeanIntadj = '';
    StdIntadj = '';
    SemIntadj = '';
end
%---------------------------------------------------
Make a color index to color cells
back to top%--------------------------------------------------- figure(1) colors = colormap; close(1) colorIdx = 1:objects; for k = 1:objects colorIdx(k) = floor( (k-1)*(64-1)/(objects-1) ) +1; end colorId = colors(colorIdx,:); clear colorIdx %---------------------------------------------------
Make a character string of numbers for all cells
back to top%--------------------------------------------------- cellnumd = (1:objects)'; cellnumd = num2str(cellnumd); %---------------------------------------------------
Make marker symbol lookup table
back to topcan only use markers if #objects <= 13
%---------------------------------------------------
mymark = ['s','o','+','d','^','p','v','*','>','x','<','.','h'];
%---------------------------------------------------
Display and publish the 1st and last image (in original intensity)
back to top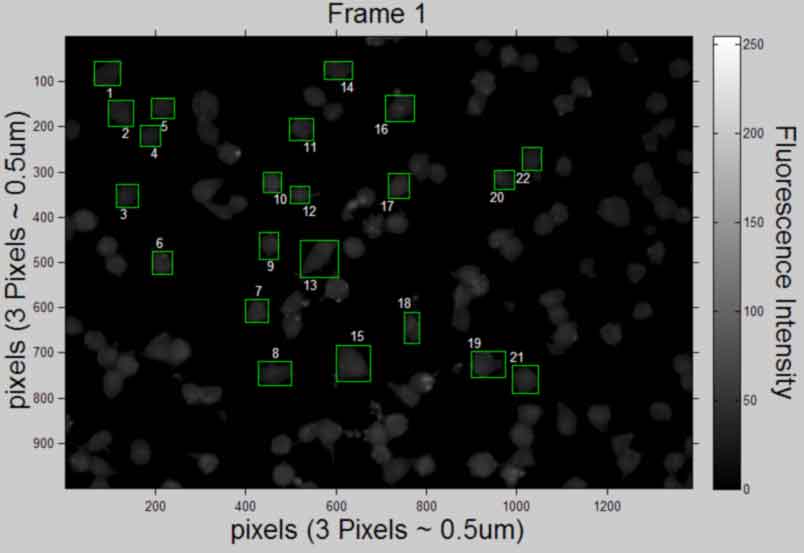
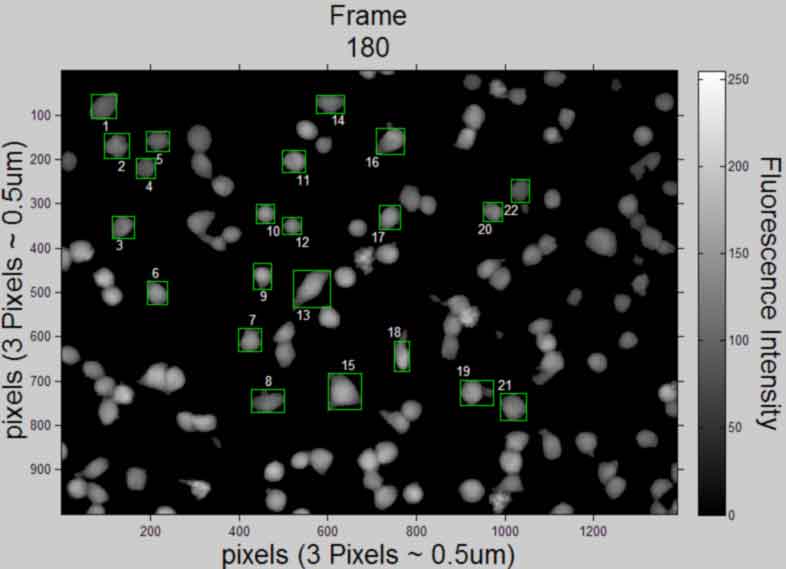
display the 1st and last image selection (in original intensity) need to store the 1st and last images I for displaying
%---------------------------------------------------
cTYfig = 'Fluorescence Intensity'; %create text
% Icellsxx = uint8(logical(L).*Icellsx);
% figure,imshow(Icellsxx(:,:,1),'InitialMagnification', 25,...
% 'Border', 'loose'), colorbar ,title('Frame 1 selection')
%     xlabel('pixels')
%     ylabel('pixels','VerticalAlignment','middle')
%     hcfig = colorbar; %create colorbar and get handle
%     hcTYfig = get(hcfig,'YLabel'); %get colorbar Yaxis title handle
%     set(hcTYfig,'String',cTYfig,'Rotation',270,...
%     'VerticalAlignment','bottom') %insert string
%     axis on;
% figure,imshow(Icellsxx(:,:,frames),'InitialMagnification', 25,...
% 'Border', 'loose'), colorbar ,title({'Frame', num2str(frames), 'selection'})
%     xlabel('pixels')
%     ylabel('pixels','VerticalAlignment','middle')
%     hcfig = colorbar; %create colorbar and get handle
%     hcTYfig = get(hcfig,'YLabel'); %get colorbar Yaxis title handle
%     set(hcTYfig,'String',cTYfig,'Rotation',270,...
%     'VerticalAlignment','bottom') %insert string
%     axis on;
figure,imshow(uint8(Icellsx(:,:,1)),'InitialMagnification', 25,...
'Border', 'loose'), colorbar, title('Frame 1','FontSize',AxisFont)
    set(gca,'FontSize',10)
    xlabel(['pixels',' (',pixeldist,')'],'FontSize',AxisFont)
    ylabel(['pixels',' (',pixeldist,')'],'FontSize',AxisFont,...
        'VerticalAlignment','baseline')
    hcfig = colorbar; %create colorbar and get handle
    hcTYfig = get(hcfig,'YLabel'); %get colorbar Yaxis title handle
    set(hcTYfig,'String',cTYfig,'Rotation',270,...
    'FontSize',AxisFont,'VerticalAlignment','bottom') %insert string
    axis on;
    k = 1; %set the frame index for cell number assignment
    Ix = size(Icellsx,2)/2; %half length of image x-axis
    Iy = size(Icellsx,1)/2; %half length of image y-axis
    for i = 1:objects
      rectangle('Position',STATS(i,k).BoundingBox,...
            'EdgeColor',[0 1 0]) %draw box around object
      Objx = STATS(i,k).Centroid(1); %centroid of object
      Objy = STATS(i,k).Centroid(2); %centroid of object
      ObjExt = floor(STATS(i,k).Extrema);
        if Objx <= Ix && Objy <= Iy %quadrant 2 of image
          text(ObjExt(5,1), ObjExt(5,2), num2str(i),...
          'HorizontalAlignment', 'left','VerticalAlignment',...
          'top','color',[1 1 1]);
        elseif Objx > Ix && Objy <= Iy %quadrant 1 of image
            text(ObjExt(6,1), ObjExt(6,2), num2str(i),...
            'HorizontalAlignment', 'right','VerticalAlignment',...
            'top','color',[1 1 1]);
        elseif Objx <= Ix && Objy > Iy %quadrant 3 of image
            text(ObjExt(2,1), ObjExt(2,2), num2str(i),...
            'HorizontalAlignment', 'left','VerticalAlignment',...
            'bottom','color',[1 1 1]);
        else %Objx > Ix && Objy > Iy %quadrant 4 of image
            text(ObjExt(1,1), ObjExt(1,2), num2str(i),...
            'HorizontalAlignment', 'right','VerticalAlignment',...
            'bottom','color',[1 1 1]);
        end
    end
    %save file
    saveas(gcf, [Treatment, ' Selection', ' Frame ', num2str(1),...
        '.pdf'], 'pdf');
    close gcf
figure,imshow(uint8(Icellsx(:,:,frames)),'InitialMagnification', 25,...
'Border', 'loose'), colorbar, title({'Frame', num2str(frames)},...
'FontSize',AxisFont)
    set(gca,'FontSize',10)
    xlabel(['pixels',' (',pixeldist,')'],'FontSize',AxisFont)
    ylabel(['pixels',' (',pixeldist,')'],'FontSize',AxisFont,...
        'VerticalAlignment','baseline')
    hcfig = colorbar; %create colorbar and get handle
    hcTYfig = get(hcfig,'YLabel'); %get colorbar Yaxis title handle
    set(hcTYfig,'String',cTYfig,'Rotation',270,...
    'FontSize',AxisFont,'VerticalAlignment','bottom') %insert string
    axis on;
    k = frames; %set the frame index for cell number assignment
    Ix = size(Icellsx,2)/2; %half length of image x-axis
    Iy = size(Icellsx,1)/2; %half length of image y-axis
    for i = 1:objects
      rectangle('Position',STATS(i,k).BoundingBox,...
            'EdgeColor',[0 1 0]) %draw box around object
      Objx = STATS(i,k).Centroid(1); %centroid of object
      Objy = STATS(i,k).Centroid(2); %centroid of object
      ObjExt = floor(STATS(i,k).Extrema);
        if Objx <= Ix && Objy <= Iy
          text(ObjExt(5,1), ObjExt(5,2), num2str(i),...
          'HorizontalAlignment', 'left','VerticalAlignment',...
          'top','color',[1 1 1]);
        elseif Objx > Ix && Objy <= Iy
            text(ObjExt(6,1), ObjExt(6,2), num2str(i),...
            'HorizontalAlignment', 'right','VerticalAlignment',...
            'top','color',[1 1 1]);
        elseif Objx <= Ix && Objy > Iy
            text(ObjExt(2,1), ObjExt(2,2), num2str(i),...
            'HorizontalAlignment', 'left','VerticalAlignment',...
            'bottom','color',[1 1 1]);
        else %Objx > Ix && Objy > Iy
            text(ObjExt(1,1), ObjExt(1,2), num2str(i),...
            'HorizontalAlignment', 'right','VerticalAlignment',...
            'bottom','color',[1 1 1]);
        end
    end
    %save file
    saveas(gcf, [Treatment, ' Selection', ' Frame ', num2str(frames),...
        '.pdf'], 'pdf');
    close gcf
%clear Icellsxx
%---------------------------------------------------
Plot Intensity vs Time for each cell and publish
back to top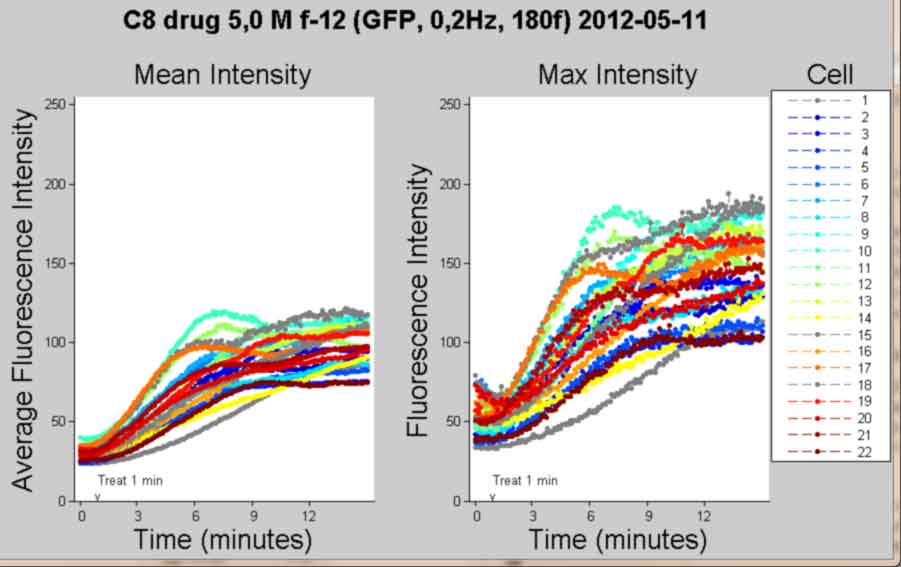
%---------------------------------------------------
PlotTitle = {[Treatment ' ' MyDate]};
% tickx = 0:60:frames; %make ticks at intervals of 60
% tickx(tickx==0) = 1; %make all zeros into ones
% tickxs = cell(length(tickx),1); %preallocate
% for k = 1:length(tickx)
%     tickxs{k} = num2str(tickx(k)); %make a cell array of tick names
% end
tickx = FluoXTick; %make tick intervals for markers
hfig1 = figure; %handle to figure
hsub1 = subplot(1,2,1); %handle to subplot
hold on; %hold figure plots, dont overwrite
title('Mean Intensity','FontSize',AxisFont);
ylabel('Average Fluorescence Intensity','FontSize',AxisFont)
if strcmp(FluoXunits,'frame')
    xlabel('Frame (Rate = 0.2Hz)','FontSize',AxisFont);
else
    xlabel('Time (minutes)','FontSize',AxisFont);
end

X1 = (1:frames)';

if objects <= 13 && strcmp(Printcolor,'BW')
    for i = 1:objects
        Y1 = meanInt(i,1,:);
        Y1 = Y1(:);
        if ObjectOut(i)
            plot(X1(tickx),Y1(tickx),mymark(i),'MarkerSize',6,...
                'MarkerFaceColor',[1 1 1], 'MarkerEdgeColor','k')
        else
            plot(X1(tickx),Y1(tickx),mymark(i),'MarkerSize',6,...
                'MarkerFaceColor',[0 0 0], 'MarkerEdgeColor','k')
        end
    end
    hlegend = legend(cellnumd, 'Location',...
        'NorthEastOutside');
    for i = 1:objects %make diff markers for line series
        Y1 = meanInt(i,1,:);
        Y1 = Y1(:);
        if ObjectOut(i)
            plot(X1,Y1, 'color',[.5 .5 .5], 'LineStyle','-')
        else
            plot(X1,Y1, 'k-')
        end
    end
else
    for i = 1:objects
        Y1 = meanInt(i,1,:);
        Y1 = Y1(:);
        if ObjectOut(i)
            plot(X1,Y1, '--','color',[0.5 0.5 0.5]...
                ,'Marker','o','MarkerSize',3,...
                'MarkerFaceColor',[0.5 0.5 0.5] )
        else
            plot(X1,Y1, '--','color',colorId(i,:)...
                ,'Marker','o','MarkerSize',3,...
                'MarkerFaceColor',colorId(i,:) )
        end
    end
    hlegend = legend(cellnumd, 'Location',...
    'NorthEastOutside');

end
ylim(FluoYLim);
hold off;

hsub2 = subplot(1,2,2);
title('Max Intensity','FontSize',AxisFont);
ylabel('Fluorescence Intensity','FontSize',AxisFont)
if strcmp(FluoXunits,'frame')
    xlabel('Frame (Rate = 0.2Hz)','FontSize',AxisFont);
else
    xlabel('Time (minutes)','FontSize',AxisFont);
end

hold on;
if objects <= 13 && strcmp(Printcolor,'BW')
    for i = 1:objects
        Y1 = maxInt(i,1,:);
        Y1 = Y1(:);
        if ObjectOut(i)
            plot(X1(tickx),Y1(tickx),mymark(i),'MarkerSize',6,...
                'MarkerFaceColor',[1 1 1], 'MarkerEdgeColor','k')
        else
            plot(X1(tickx),Y1(tickx),mymark(i),'MarkerSize',6,...
                'MarkerFaceColor',[0 0 0], 'MarkerEdgeColor','k')
        end
    end
    for i = 1:objects %make diff markers for line series
        Y1 = maxInt(i,1,:);
        Y1 = Y1(:);
        if ObjectOut(i)
            plot(X1,Y1, 'color',[0.5 0.5 0.5], 'LineStyle','-')
        else
            plot(X1,Y1, 'k-')
        end
    end
else
    for i = 1:objects
        Y1 = maxInt(i,1,:);
        Y1 = Y1(:);
        if ObjectOut(i)
            plot(X1,Y1, '--','color',[0.5 0.5 0.5]...
                ,'Marker','o','MarkerSize',3,...
                'MarkerFaceColor',[0.5 0.5 0.5] )
        else
            plot(X1,Y1, '--','color',colorId(i,:)...
                ,'Marker','o','MarkerSize',3,...
                'MarkerFaceColor',colorId(i,:) )
        end
    end
end
ylim(FluoYLim);
htitle = text(1, 1, PlotTitle, 'FontSize', AxisFont,...
    'FontWeight', 'bold', 'HorizontalAlignment',...
    'center');
hold off;
titlepos = [-36 303.382 17.3205];
legpos =[0.8551, 0.1112, 0.1283, 0.7641]; %position
legout = [0.86, 0.1061, 0.1390, 0.7691]; %position
legPBR = [1 3.1250 1]; %aspect ratio
legDAR = [1 0.3200 2]; %aspect ratio
sub1pos = [0.0820, 0.10, 0.32, 0.7]; %position
sub1out = [0.01, -0.109, 0.42, 1.025]; %position
sub2pos = [0.5, 0.10, 0.32, 0.7]; %position
sub2out = [0.4492, -0.109, 0.42, 1.025]; %position
set(hfig1,'PaperOrientation','landscape');
set(htitle,'Position', titlepos);
set(hlegend,'FontSize', 10);
set(hlegend,'Position',legpos);
set(hlegend,'OuterPosition',legout);
set(hlegend,'DataAspectRatio',legDAR);
set(hlegend,'PlotBoxAspectRatio',legPBR);
set(hsub1,'TickDir','out');
set(hsub1,'Position',sub1pos);
set(hsub1,'OuterPosition',sub1out);
set(hsub1,'XLim',FluoXLim); %x-axis limits
set(hsub1,'XTick', FluoXTick);
set(hsub1,'XTickLabel',FluoXTickS);
set(hsub1,'YTick', FluoYTick);
set(hsub1,'YTickLabel',FluoYTickS);
set(hsub2,'TickDir','out');
set(hsub2,'Position',sub2pos);
set(hsub2,'OuterPosition',sub2out);
set(hsub2,'Xlim',FluoXLim);
set(hsub2,'XTick', FluoXTick);
set(hsub2,'XTickLabel',FluoXTickS);
set(hsub2,'YTick', FluoYTick);
set(hsub2,'YTickLabel',FluoYTickS);
if FrameTreat ~= 0 %mark treat time if treated
    hsub1at = text(FrameTreat,FluoYLim(1),...
                '{\fontname{arial}v}',...
                'Parent',hsub1,'Color',[.1 .1 .1],'Fontsize', 10,...
                'HorizontalAlignment','Center',...
                'VerticalAlignment','baseline');
    hsub1bt = text(FrameTreat,FluoYLim(1)+10,...
                ['Treat ',num2str(TimeTreat), ' min'],...
                'Parent',hsub1,'Color',[.1 .1 .1],'Fontsize', 10,...
                'HorizontalAlignment','Left',...
                'VerticalAlignment','baseline');
    hsub2at = text(FrameTreat,FluoYLim(1),...
                '{\fontname{arial}v}',...
                'Parent',hsub2,'Color',[.1 .1 .1],'Fontsize', 10,...
                'HorizontalAlignment','Center',...
                'VerticalAlignment','baseline');
    hsub2bt = text(FrameTreat,FluoYLim(1)+10,...
                ['Treat ',num2str(TimeTreat), ' min'],...
                'Parent',hsub2,'Color',[.1 .1 .1],'Fontsize', 10,...
                'HorizontalAlignment','Left',...
                'VerticalAlignment','baseline');
    hlegendt = text(0.5,1,'Cell','Parent',hlegend,'units','normalized',...
        'VerticalAlignment','bottom','HorizontalAlignment','center',...
        'FontSize',AxisFont);
end
%save figure
saveas(gcf, [Treatment, ' Mean and Max Intensity Plots', '.pdf'], 'pdf');
close gcf
%---------------------------------------------------
Plot Intensity vs Time(frame) and publish
back to top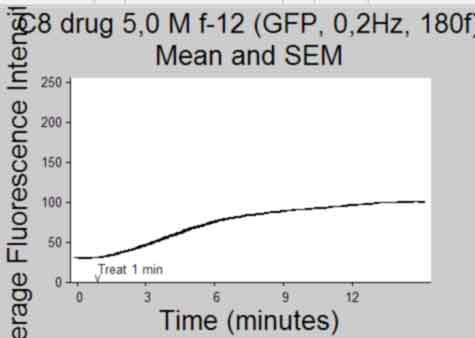
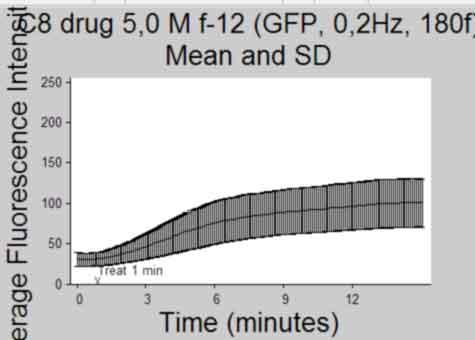
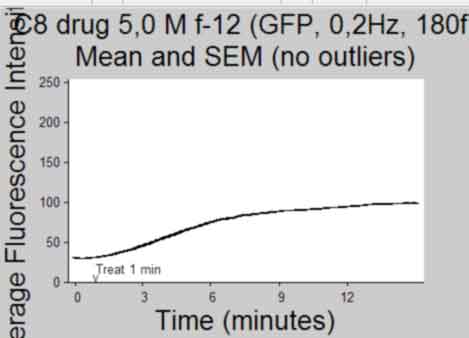
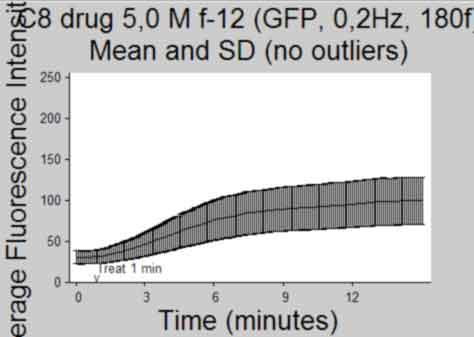
%---------------------------------------------------
Ytemp = {SemInt; StdInt; SemIntadj; StdIntadj};
Titletemp = {'Mean and SEM'; 'Mean and SD'; 'Mean and SEM (no outliers)';...
    'Mean and SD (no outliers)' };
MeanIntTemp = {MeanInt; MeanInt; MeanIntadj; MeanIntadj};
for k = 1:4
    if k>2 && isempty(find(ObjectOut,1))
        continue %skip iteration if k>2 and if there were no outliers identified
    end
    figure;
    herr = errorbar(MeanIntTemp{k},Ytemp{k},'k'); %plot using errorbar function
    % herrleg = legend({'Mean Fluorescence Intensity'},...
    %     'Location','NorthEastOutside','Orientation',...
    %     'vertical');
    title({Treatment;Titletemp{k}},'FontSize',AxisFont);
    %title(file)
    ylabel('Average Fluorescence Intensity','FontSize',AxisFont);
    if strcmp(FluoXunits,'frame')
        xlabel('Frame (Rate = 0.2Hz)','FontSize',AxisFont);
    else
        xlabel('Time (minutes)','FontSize',AxisFont);
    end
    xlim(FluoXLim)
    ylim(FluoYLim)
    haxes = gca; %get current axes handle
    set(haxes,'TickDir','out', 'box','off');
    set(haxes,'XTick', FluoXTick); %set xticks
    set(haxes,'XTickLabel', FluoXTickS,'FontSize',10); %set the Xlabels
    set(haxes,'YTick', FluoYTick); %set yticks
    set(haxes,'YTickLabel', FluoYTickS,'FontSize',10); %set the Ylabels
    if FrameTreat ~= 0 %mark treat time if treated
    h3atxt = text(FrameTreat,FluoYLim(1),...
            '{\fontname{arial}v}',...
            'Color',[.1 .1 .1],'Fontsize', 10,...
            'HorizontalAlignment','Center',...
            'VerticalAlignment','baseline');
    h3btxt = text(FrameTreat,FluoYLim(1)+10,...
            ['Treat ',num2str(TimeTreat), ' min'],...
            'Color',[.1 .1 .1],'Fontsize', 10,...
            'HorizontalAlignment','Left',...
            'VerticalAlignment','baseline');
    end
    %save figure
    saveas(gcf, [Treatment, ' ', Titletemp{k}, ' Plot', '.pdf'], 'pdf');
    close gcf
end
clear Ytemp Titletemp MeanIntTemp
%-----------------------------------------------
Plot a Curve Fit to response after treatment
back to top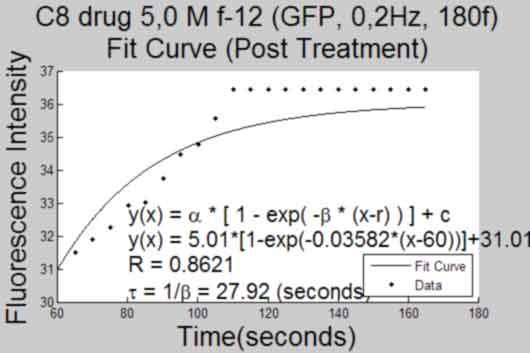
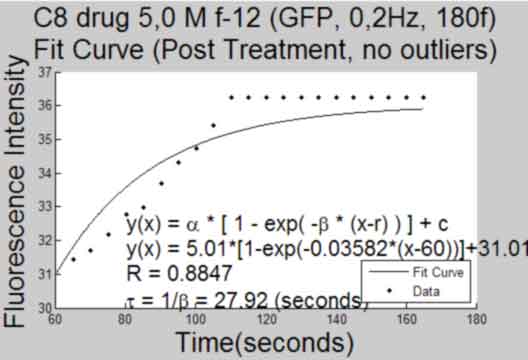
%-----------------------------------------------
if FrameTreat ~= 0
    fitcurve = [];
    goodness = [];
    TitleTemp = 'Fit Curve (Post Treatment)';
    eval('[fitcurve goodness] = myfit2(MeanInt,FrameTreat)') %get fit curve to data with outliers
    set(gca,'Box','off');
    gcf; title({Treatment; TitleTemp},'FontSize',AxisFont);
    saveas(gcf,[Treatment, ' ', TitleTemp, 'Plot', '.pdf'], 'pdf');
    close gcf;
    if ~isempty(find(ObjectOut,1))
        fitcurveadj = [];
        goodnessadj = [];
        TitleTemp = 'Fit Curve (Post Treatment, no outliers)';
        eval('[fitcurveadj goodnessadj] = myfit2(MeanIntadj,FrameTreat)') %get fit curve to data without outliers
        set(gca,'Box','off');
        gcf; title({Treatment; TitleTemp},'FontSize',AxisFont);
        saveas(gcf,[Treatment, ' ', TitleTemp, 'Plot', '.pdf'], 'pdf');
        close gcf;
    end
end
%-----------------------------------------------
Save Variables
back to top%----------------------------------------------- if FrameTreat ~= 0 && ~isempty(find(ObjectOut,1)) %save when Treated and when outliers exist save([Treatment,' variables','.mat'], 'MeanInt',... 'STATS','SemInt','StdInt','maxInt','meanInt','semInt','fitcurve',... 'goodness','fitcurveadj','goodnessadj'); elseif FrameTreat ~= 0 && isempty(find(ObjectOut,1)) %save when Treated and no outliers save([Treatment,' variables','.mat'], 'MeanInt',... 'STATS','SemInt','StdInt','maxInt','meanInt','semInt','fitcurve',... 'goodness'); elseif FrameTreat == 0 && ~isempty(find(ObjectOut,1)) %save when not treated and outliers exist save([Treatment,' variables','.mat'], 'MeanInt',... 'STATS','SemInt','StdInt','maxInt','meanInt','semInt'); else %save when not treated and no outliers save([Treatment,' variables','.mat'], 'MeanInt',... 'STATS','SemInt','StdInt','maxInt','meanInt','semInt'); end %-----------------------------------------------
Plot Radialwise Intensity and publish
back to top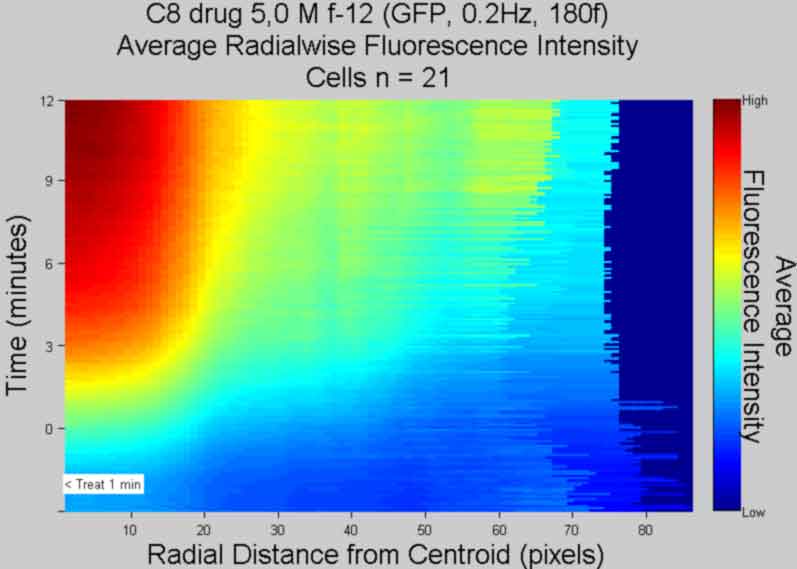
%-----------------------------------------------
%%Create Rings
% rings will overlap betwen adjacent radii because
% of discrete shape of image pixels
%%Set Constant Parameter & preallocate arrays
Theta = linspace(0,2*pi,40);
Ring = cell(objects,frames); %create cell to store cell r data
cellboxw = 1:objects;
cellboxh = cellboxw;
Cellsub = cell(objects,1); %create cell array to store cropped cells
%%Get Parameters one frame at a time
for fr = 1:frames; %iterate through frames
    for i = 1:objects %iterate through objects
        centroid1 = floor(STATS(i,fr).Centroid);
        uLcorner1 = ceil(STATS(i,fr).BoundingBox(1:2));
        centroid1sub = centroid1 - uLcorner1 + 1; %get sub centroid coordinates
        cellboxw(i) = ceil(STATS(i,fr).BoundingBox(3))-1;
        cellboxh(i) = ceil(STATS(i,fr).BoundingBox(4))-1;
        cellboxW = uLcorner1(1):uLcorner1(1)+cellboxw(i);%turn over for each object
        cellboxH = uLcorner1(2):uLcorner1(2)+cellboxh(i); %turn over for each object
        Cellsub{i,1} = Icellsx(cellboxH,cellboxW,fr); %turn over for ea frame
        rlim = ceil(1.415*max([cellboxw(i),cellboxh(i)])/2); %find max angular radii for object i
        Ring{i,fr} = cell(rlim,1); %create cell arrays in Ring to store radii data
        %Make circle r1
        for k=1 %iterate through r1
            r = k; %radius of circle in pixels
            Rho = ones(1,40)*r; %create array of angles
            [X Y] = pol2cart(Theta,Rho); %convert to cartesian
            X = ((X+centroid1sub(1))); %shift center of circles
            Y = (Y+size(Cellsub{i,1},1)-centroid1sub(2)+1);
            BWr = roipoly(Cellsub{i,1},X,Y); %use Cellsub vs Template
            %BWr = roipoly(Template,X,Y); %create bw template for r
            BWr = bwmorph(BWr,'spur'); %remove "thorns"
            [R C] = find(BWr); %find all coordinates of ring
            Idx = sub2ind(size(BWr),R,C); %convert coordinates to linear index
            Ring{i,fr}{k,1}(1,:) = Idx; %store linear index
            V = Cellsub{i,1}(Idx); %get intensity
            Ring{i,fr}{k,1}(2,:) = V; %store intensity
            clear C R X Y V
        end
        %Make circles 2-rlim
        %For loop start with ring 3 end with ring rlim
        %counter will be set to k, create r=k+2 and r=k rings
        for k = 2:rlim %iterate through r2+
            r = k; %radius of circle in pixels, not inclusive
            Rho = ones(1,40)*r; %create array of angles
            [X Y] = (pol2cart(Theta,Rho)); %convert to cartesian
            X = ((X+centroid1sub(1))); %shift center of circles
            Y = (Y+size(Cellsub{i,1},1)-centroid1sub(2)+1);
            BWr = roipoly(Cellsub{i,1},X,Y); %create bw template for r
            BWr = bwmorph(BWr,'spur');
            BWr = bwmorph(BWr,'remove');
            clear X Y
            [R C] = find(BWr); %get coordinates of ring
            if isempty(R) %stop iterating through radii if radii rings fall off
                break
            end
            Idx = sub2ind(size(BWr),R,C); %convert coordinates to linear index
            V = Cellsub{i,1}(Idx); %get intensity
            if r >= round(1/1.415*(rlim)) %start checking values at orthoganol radii
                if sum(V) == 0 %stop writing values if equal to zero
                    break
                end
            end
            Ring{i,fr}{k,1}(1,:) = Idx; %store index
            Ring{i,fr}{k,1}(2,:) = V; %store intensity
            clear C R X Y V
        end
    end
end
clear BWr* cellbox* Cellsub
%%Go through all frames and compute the average r values for each object
%%and for all cells
%Robjects = cell(objects,1);
Rframes = cell(1,frames); %replace second entry with frames
for i = 1:frames %iterate through frames
    for j = 1:size(Ring(:,i),1) %iterate through objects
        a(j) = size(Ring{j,i},1); %get size of radii for each object in frame
    end
    a = max(a); %get max radii size for frame i
    Rframes{1,i} = cell(a,1); %preallocate cell size of length max radii
    for j = 1:objects %iterate through objects
        for k = 1:size(Ring{j,i},1) %iterate through radii
                %Store radii collapse objects, maintain frames
                Rframes{1,i}{k,1} = cat(2,Rframes{1,i}{k,1},...
                Ring{j,i}{k,1}(2,:));
        end
    end
end
clear Ring

%%Find the mean value for radii of each frame
for i = 1:frames %iterate through frames
    for j = 1:size(Rframes{1,i},1) %iterate through radii
        Rmeanframes{1,i}(j,1) = mean(nonzeros(Rframes{1,i}{j,1}));
        Rstd = std(nonzeros(Rframes{1,i}{j,1}));
        Rstderrframes{1,i}(j,1) = Rstd/sqrt(nnz(Rframes{1,i}{j,1}));
    end
end
clear Rframes

%create a matrix of radii
%Yaxis Frame #
%Xaxis Radial distance from centroid
%Zaxis Average Radialwise Fluorescence Intensity
%A = cell2mat(Rmeanframes); %create a matrix, might error if dim wrong
A = [];
for k = 1:frames %iterate through frames
    A(1:size(Rmeanframes{1,k},1),k) = Rmeanframes{1,k}(:); %(RFIxFrame)
end
A = fliplr(A); %flip matrix columns, mirror the frame axis (FramexRFI)
hfsurf = figure; %create figure and get handle
hsurf = surf(A); %create mesh plot for Rmeanframes
if strcmp(Printcolor,'BW')
    colormap gray
else
    colormap jet
end
title({Treatment;...
    'Average Radialwise Fluorescence Intensity';...
    ['Cells n = ', num2str(objects)] },'FontSize',AxisFont) %update
if strcmp(FluoXunits,'minutes')
    xlabel('Time (minutes)','FontSize',AxisFont)
else
    xlabel('Frame (Rate = 0.2Hz)','FontSize',AxisFont)
end
ylabel('Radial Distance from Centroid (pixels)','FontSize',AxisFont)
zlabel('Radialwise Average Fluorescence Intensity','FontSize',AxisFont)
set(hsurf,'EdgeColor','flat') %set edge box color
set(hfsurf,'Position',[50 250 550 400]); %position figure window
view(90,90); %change surf orientation
hcsurf = colorbar; %create colorbar and get handle
% xtickdiv = frames/6; %create x-axis divisions space
% xtickdiv = 0:xtickdiv:frames; %create x-axis
% xtickdiv(xtickdiv==0)=1; %make 0 = 1
haxes = gca; %get current axes handle
set(haxes,'XLim',[1 frames]) %set x-axis limits
set(haxes,'XTick',FluoXTick) %set x-axis ticks
set(haxes,'XTickLabel',flipud(FluoXTickS)) %write reverse labels
% xtickL = get(haxes,'XTick'); %get x-axis labels
% xtickL = fliplr(xtickL); %make the reverse of x-axis labels
% set(haxes,'XTickLabel', xtickL); %write reverse the Xlabels
radialLim = size(A);
set(haxes,'Ylim',[1 radialLim(1)])
set(haxes,'XGrid','off','YGrid','off','ZGrid','off')
set(haxes,'TickDir','out')
cTLsurf = get(hcsurf,'YLim'); %get colorbar limits
set(hcsurf,'YTick',cTLsurf) %create ticks at limits
set(hcsurf,'YTickLabel',{'Low','High'}) %create Yticklabels
cTYSsurf = {'Average'; 'Fluorescence Intensity'}; %create colorbar title string
hcTYsurf = get(hcsurf,'YLabel'); %get colorbar Yaxis title handle
set(hcTYsurf,'String',cTYSsurf,'Rotation',270,...
    'VerticalAlignment','baseline','FontSize',AxisFont) %insert string
%tightmap %eliminate/reduce white boarder
ztemp = zlim;
ztemp = ztemp(2);
if FrameTreat ~= 0 %mark treat time if treated
    text(frames-FrameTreat,1,ztemp,['< Treat ',num2str(TimeTreat),' min'],...
        'fontsize',10,'Color',[.1 .1 .1],...
        'BackgroundColor','w')
end
%save file
saveas(gcf, [Treatment, ' Average Radial Fluorescence', '.pdf'], 'pdf');
close gcf
%-----------------------------------------------
Save Variables
back to top%----------------------------------------------- if FrameTreat ~= 0 save([Treatment,' variables','.mat'], 'Treatment','MeanInt','Rmeanframes','Rstderrframes',... 'STATS','SemInt','StdInt','maxInt','meanInt','semInt'); else save([Treatment,' variables','.mat'], 'Treatment','MeanInt','Rmeanframes','Rstderrframes',... 'STATS','SemInt','StdInt','maxInt','meanInt','semInt','fitcurve','goodness'); end %-----------------------------------------------
Make Avi Movie of original images and Mean +/- SD Inensity of Cell Selection
back to top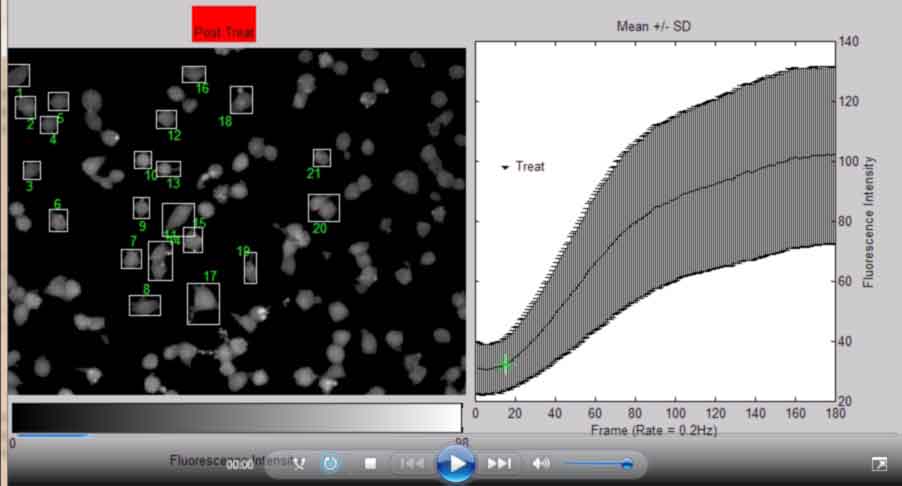
%-----------------------------------------------
%Open video object and append frames from Image stack
aviobj = VideoWriter([Treatment,' ', MyDate,'.avi']); %make file name
aviobj.FrameRate = 12; %frames per second
aviobj.Quality = 100; %percent quality
open(aviobj); %open an object file

for k = 1:frames;
    fig = figure(1);
    h12=subplot(1,2,1);
    imshow(Icellsx(:,:,k),'DisplayRange',...
            [min(min(Icellsx(:,:,k))),max(max(Icellsx(:,:,k)))],...
            'InitialMagnification', 25,'Border', 'loose'); %do not scale 8bit map
    %imshow(Icellsx(:,:,k)),...
        hcb = colorbar('location','SouthOutside');
        if k < FramePostTreat;
            title({'Pre Treat'; []},'backgroundcolor',[0 1 0]);
        else
            title({[]; 'Post Treat'},'backgroundcolor',[1 0 0]);
        end
    htxt = text(1,1.35,{['NSC-34 ', Passage, ' ', Treatment,' ', MyDate,];...
        ['Frame ', num2str(k),' of ', num2str(frames),...
        FrameRate]}, 'Fontsize', 18,'HorizontalAlignment',...
        'Center', 'Units','normalized');
    h22=subplot(1,2,2); errorbar(MeanInt,StdInt,['k','-']), hold on,...
        %hleg = legend('mean', 'max','Location', 'SouthOutside');
        plot(k,MeanInt(k),['b','*']),...
        %plot(k,maxall(k), ['k','*']),...
        title('Mean +/- SD'), ylabel('Fluorescence Intensity'),...
        xlabel('Frame (Rate = 0.2Hz)'), xlim([0 frames]);
    h2txt = text(12,ceil(0.95*(max(max(MeanInt)))),...
        {['{\fontname{Webdings}6} ','Treat']},...
        'Fontsize', 10, 'HorizontalAlignment','Left');
    hold off;
    axis(h12,'image'),axis(h12,'off');
    set(h12,'Position',[0 0 0.6 1]);
    set(h12,'OuterPosition',[-0.08 -0.08 0.6 1]);
    axis(h22,'square');
    set(h22,'OuterPosition',[0.49 -0.4 0.5 1.5]);
    set(h22,'Position',[0.52 -0.07 0.4 1.07]);
    set(h22,'YAxisLocation', 'right');
    %set(hleg,'Position',[0.67 0.05 0.16 0.1])
    set(hcb,'XTick',[0 max(max(Icellsx(:,:,k)))]);
    set(hcb,'Position',[0.005 0.1 0.5 0.0500]);
    xlabel(hcb,'Fluorescence Intensity');
%     for i = 1:objects %original bounding box drawing
%         if k < FramePostTreat
%             rectangle('Position',STATS(i,k).BoundingBox,...
%             'EdgeColor',[0 0 1],'Parent',h12)
%         else
%             rectangle('Position',STATS(i,k).BoundingBox,...
%             'EdgeColor',[0 0 1],'Parent',h12)
%         end
%     end

    for i = 1:objects %new bounding box drawing with numbers
      rectangle('Position',STATS(i,k).BoundingBox,...
            'EdgeColor',[0 0 1],'Parent',h12) %draw box around object
      Objx = STATS(i,k).Centroid(1); %centroid of object
      Objy = STATS(i,k).Centroid(2); %centroid of object
      ObjExt = floor(STATS(i,k).Extrema);
        if Objx <= Ix && Objy <= Iy %quadrant 2 of image
          text(ObjExt(5,1), ObjExt(5,2), num2str(i),...
          'HorizontalAlignment', 'left','VerticalAlignment',...
          'top','color',[1 1 1],'Parent',h12);
        elseif Objx > Ix && Objy <= Iy %quadrant 1 of image
            text(ObjExt(6,1), ObjExt(6,2), num2str(i),...
            'HorizontalAlignment', 'right','VerticalAlignment',...
            'top','color',[1 1 1],'Parent',h12);
        elseif Objx <= Ix && Objy > Iy %quadrant 3 of image
            text(ObjExt(2,1), ObjExt(2,2), num2str(i),...
            'HorizontalAlignment', 'left','VerticalAlignment',...
            'bottom','color',[1 1 1],'Parent',h12);
        else %Objx > Ix && Objy > Iy %quadrant 4 of image
            text(ObjExt(1,1), ObjExt(1,2), num2str(i),...
            'HorizontalAlignment', 'right','VerticalAlignment',...
            'bottom','color',[1 1 1],'Parent',h12);
        end
    end

    F = getframe(gcf); %get current figure handle
    writeVideo(aviobj,F); %write current frame to aviobj

end
close(gcf);
close(aviobj);

back to top