Contents
- INITIALIZE GUI
- RESET BUTTON - Restarts session on current waveform analysis
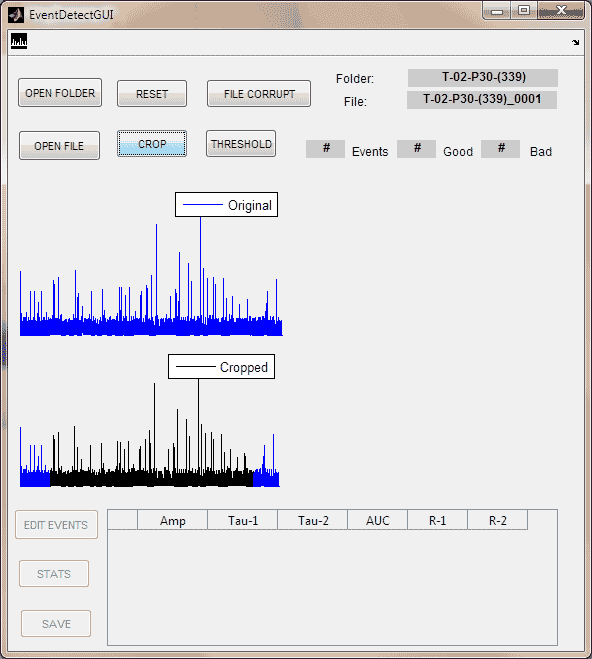
- CROP - Starts crop interaction
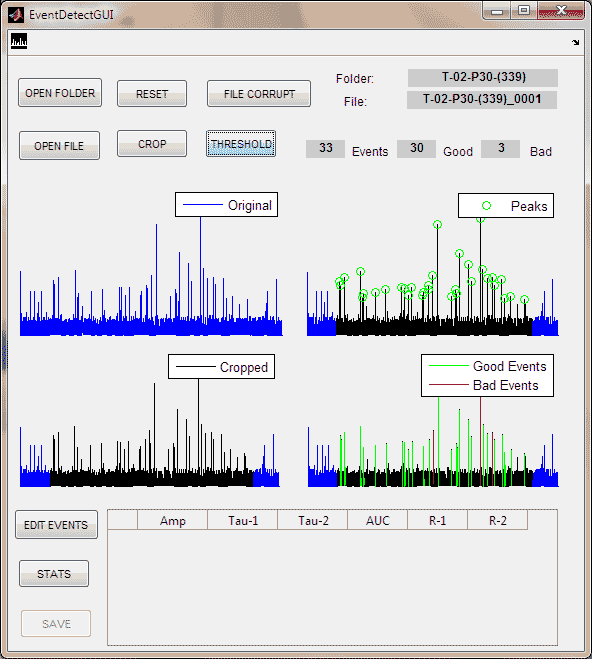
- PEAK THRESHOLD - Starts threshold interaction
- FILE CORRUPT - Skip analysis and documet file as bad
- OPEN FOLDER - Initialize dialog box. Open directory containing results from animal
- OPEN FILE - Initialized open dialog box and open a waveform data file with .abf
- EDIT EVENTS - Open new gui to edit even detection
- STATS Generate - Event Stats
- SAVE - Saves event statistics to a .mat file
- PLOT - Saves record to a .pdf file
INITIALIZE GUI.
back to top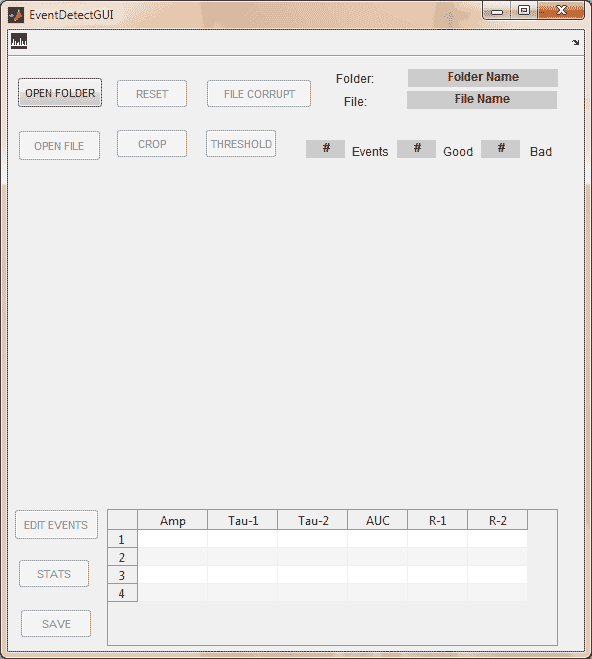
------------
function varargout = EventDetectGUI(varargin)
% EVENTDETECTGUI MATLAB code for EventDetectGUI.fig
%      EVENTDETECTGUI, by itself, creates a new EVENTDETECTGUI or raises the existing
%      singleton*.
%
%      H = EVENTDETECTGUI returns the handle to a new EVENTDETECTGUI or the handle to
%      the existing singleton*.
%
%      EVENTDETECTGUI('CALLBACK',hObject,eventData,handles,...) calls the local
%      function named CALLBACK in EVENTDETECTGUI.M with the given input arguments.
%
%      EVENTDETECTGUI('Property','Value',...) creates a new EVENTDETECTGUI or raises the
%      existing singleton*.  Starting from the left, property value pairs are
%      applied to the GUI before EventDetectGUI_OpeningFcn gets called.  An
%      unrecognized property name or invalid value makes property application
%      stop.  All inputs are passed to EventDetectGUI_OpeningFcn via varargin.
%
%      *See GUI Options on GUIDE's Tools menu.  Choose "GUI allows only one
%      instance to run (singleton)".
%
% See also: GUIDE, GUIDATA, GUIHANDLES

% Edit the above text to modify the response to help EventDetectGUI

% Last Modified by GUIDE v2.5 15-May-2014 22:50:44

% Begin initialization code - DO NOT EDIT
gui_Singleton = 1;
gui_State = struct('gui_Name',       mfilename, ...
                   'gui_Singleton',  gui_Singleton, ...
                   'gui_OpeningFcn', @EventDetectGUI_OpeningFcn, ...
                   'gui_OutputFcn',  @EventDetectGUI_OutputFcn, ...
                   'gui_LayoutFcn',  [] , ...
                   'gui_Callback',   []);
if nargin && ischar(varargin{1})
    gui_State.gui_Callback = str2func(varargin{1});
end

if nargout
    [varargout{1:nargout}] = gui_mainfcn(gui_State, varargin{:});
else
    gui_mainfcn(gui_State, varargin{:});
end
% End initialization code - DO NOT EDIT

% --- Executes just before EventDetectGUI is made visible.
%function EventDetectGUI_OpeningFcn(hObject, eventdata, handles, varargin)
% This function has no output args, see OutputFcn.
% hObject    handle to figure
% eventdata  reserved - to be defined in a future version of MATLAB
% handles    structure with handles and user data (see GUIDATA)
% varargin   command line arguments to EventDetectGUI (see VARARGIN)

% Choose default command line output for EventDetectGUI
handles.output = hObject;
% Update handles structure
guidata(hObject, handles);

% Hide Axes
axes(handles.axes1); %activate axes1
    set(handles.axes1,'visible','off')
    axis off;
axes(handles.axes2); %activate axes2
    axis off;
    set(handles.axes2,'visible','off')
axes(handles.axes3); %activate axes3
    axis off;
    set(handles.axes3,'visible','off')
axes(handles.axes4); %activate axes4
    axis off;
    set(handles.axes4,'visible','off')
% Initialize variables
mydirChooseCount = 0;
    assignin('base','mydirChooseCount',mydirChooseCount);
evalin('base','mydirChoose = pwd;');

% --- Outputs from this function are returned to the command line.
function varargout = EventDetectGUI_OutputFcn(hObject, eventdata, handles)
% varargout  cell array for returning output args (see VARARGOUT);
% hObject    handle to figure
% eventdata  reserved - to be defined in a future version of MATLAB
% handles    structure with handles and user data (see GUIDATA)

% Get default command line output from handles structure
varargout{1} = handles.output;


% ------------ Executes on button press in pushbutton1.
RESET BUTTON. Restarts session on current waveform analysis
back to top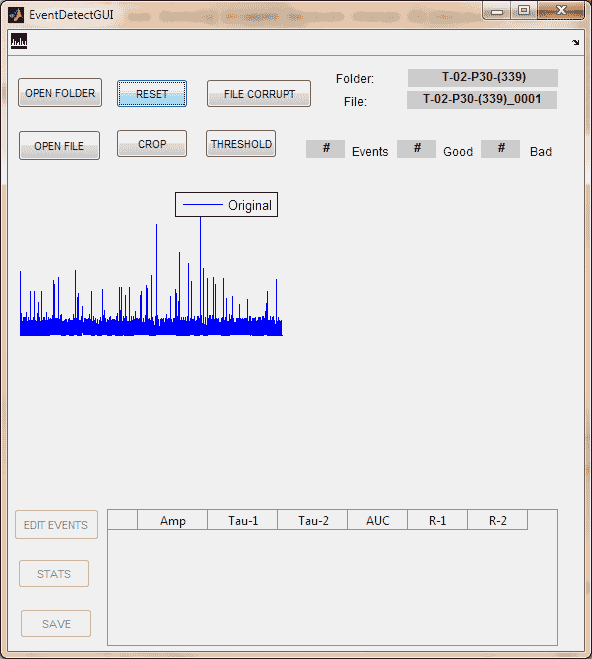
------------
function pushbutton1_Callback(hObject, eventdata, handles)
% hObject    handle to pushbutton1 (see GCBO)
% eventdata  reserved - to be defined in a future version of MATLAB
% handles    structure with handles and user data (see GUIDATA)
% Clear variable from workspace
evalin('base','clear myEvents myEventsFlag peakSet peakThreshold EventDataStats hfigStats');
% clear uitable1 data
set(handles.uitable1,'Data',[]); %set data array to empty
% initialize variables
ytempLeft = [];
assignin('base','ytempLeft',ytempLeft);
ytempRight = [];
assignin('base','ytempRight',ytempRight);
ytempCrop = [];
assignin('base','ytempCrop',ytempCrop);
limitsCrop = [];
assignin('base','limitsCrop',limitsCrop);
% clear axes 2,3,4
cla(handles.axes2,'reset');
set(handles.axes2,'visible','off')
axis off;
cla(handles.axes3,'reset');
set(handles.axes3,'visible','off')
axis off;
cla(handles.axes4,'reset');
set(handles.axes4,'visible','off')
axis off;
% enable buttons: file corrupt, reset, crop, threshold
set(handles.pushbutton4,'Enable','on'); % FILE CORRUPT
set(handles.pushbutton1,'Enable','on'); % RESET
set(handles.pushbutton2,'Enable','on'); % CROP
set(handles.pushbutton3,'Enable','on'); % THRESHOLD
% disable buttons: stats, edit events, save
set(handles.pushbutton8,'Enable','off'); % STATS
set(handles.pushbutton6,'Enable','off'); % EDIT EVENTS
set(handles.pushbutton9,'Enable','off'); % SAVE
% clear text8, 9,  10
set(handles.text8,'string','#'); %Events
set(handles.text9,'string','#'); %Good Events
set(handles.text10,'string','#'); %Bad Events


% ---- Executes on button press in pushbutton2.
CROP. Starts crop interaction
back to top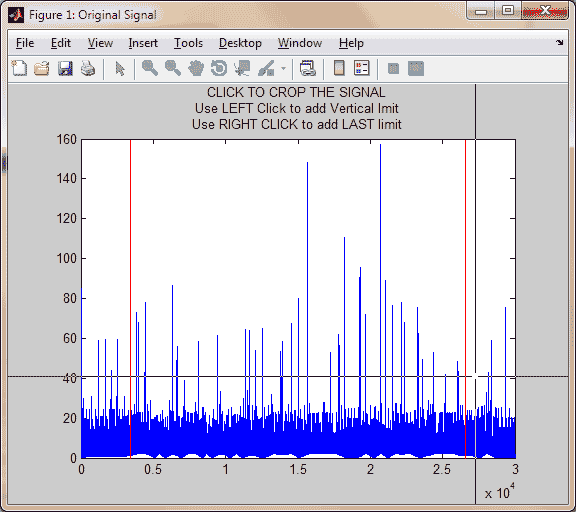
----
function pushbutton2_Callback(hObject, eventdata, handles)
% hObject    handle to pushbutton2 (see GCBO)
% eventdata  reserved - to be defined in a future version of MATLAB
% handles    structure with handles and user data (see GUIDATA)
%
% clear axes 2,3,4
cla(handles.axes2,'reset');
set(handles.axes2,'visible','off')
axis off;
cla(handles.axes3,'reset');
set(handles.axes3,'visible','off')
axis off;
cla(handles.axes4,'reset');
set(handles.axes4,'visible','off')
axis off;
% run signalCrop function
mycell = evalin('base','mycell');
[y1 limitsCrop hfigOriginal hfigCrop] = signalCrop(mycell);
close(hfigOriginal);
close(hfigCrop);
assignin('base','y1',y1);
assignin('base','limitsCrop',limitsCrop);
% plot the cropped waveform with padded edges where cropped
celltemp = nan(size(mycell));
ytempCrop = celltemp;
ytempCrop(limitsCrop(1):limitsCrop(2)) = y1;
assignin('base','ytempCrop',ytempCrop);
axes(handles.axes2); %activate axes2
plot(ytempCrop,'k'); legend('Cropped')
if limitsCrop(1) > 1 %plot the left cropped area and color gray
    ytempLeft = celltemp;
    ytempLeft(1:limitsCrop(1)-1) = mycell(1:limitsCrop(1)-1);
    hold on;
    plot(ytempLeft,'b');
    assignin('base','ytempLeft',ytempLeft);
end
if limitsCrop(2) < length(mycell) %plot the right cropped area and color gray
    ytempRight = celltemp;
    ytempRight(limitsCrop(2)+1:end) = mycell(limitsCrop(2)+1:end);
    hold on;
    plot(ytempRight,'b');
    assignin('base','ytempRight',ytempRight);
end
hold off;
axis off;

% disable edit events
set(handles.pushbutton6,'Enable','off'); % EDIT EVENTS
% disable stats
set(handles.pushbutton8,'Enable','off'); % STATS
% turn save button off
set(handles.pushbutton9,'Enable','off'); %SAVE
% clear uitable1 data
set(handles.uitable1,'Data',[]); %set data array to empty
% clear text8, 9,  10
set(handles.text8,'string','#'); %Events

set(handles.text9,'string','#'); %Good Events
set(handles.text10,'string','#'); %Bad Events


% -------------- Executes on button press in pushbutton3.
PEAK THRESHOLD. Starts threshold interaction
back to top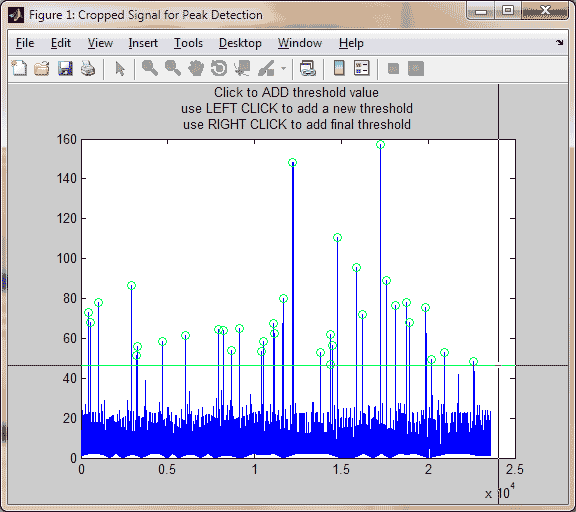
--------------
function pushbutton3_Callback(hObject, eventdata, handles)
% hObject    handle to pushbutton3 (see GCBO)
% eventdata  reserved - to be defined in a future version of MATLAB
% handles    structure with handles and user data (see GUIDATA)
cla(handles.axes3,'reset');
set(handles.axes3,'visible','off')
axis off;
cla(handles.axes4,'reset');
set(handles.axes4,'visible','off')
axis off;
ytempLeft = evalin('base','ytempLeft');
ytempRight = evalin('base','ytempRight');
y1 = evalin('base','y1');
[peakSet peakThreshold hfigPeak] = getPeaks(y1);
assignin('base','peakSet',peakSet);
assignin('base','peakThreshold',peakThreshold);
close(hfigPeak);
axes(handles.axes3); %activate axes3
if ~isempty(ytempLeft) && ~isempty(ytempRight)
    limitsCrop = evalin('base','limitsCrop');
    ytempCrop = evalin('base','ytempCrop');
    plot(ytempCrop,'k');
    hold on;
    hpeaks = plot(peakSet +limitsCrop(1)-1 , y1(peakSet),'go');
    legend(hpeaks,'Peaks');
    plot(ytempLeft,'b');
    plot(ytempRight,'b');
else
    plot(y1,'k');
    hold on;
    hpeaks = plot(peakSet,y1(peakSet),'go');
    legend(hpeaks, 'Peaks');
end
hold off;
axis off;

[myEvents myEventsFlag, hfigEvents] = getEvents(peakSet,y1);
close(hfigEvents)
assignin('base', 'myEvents', myEvents);
assignin('base', 'myEventsFlag', myEventsFlag);
% update text8, 9,  10
set(handles.text8,'string',num2str(size(myEvents,1))); %Events
set(handles.text9,'string',num2str(size(myEvents,1) - sum(myEventsFlag) )); %Good Events
set(handles.text10,'string',num2str(sum(myEventsFlag))); %Bad Events

axes(handles.axes4); %activate axes4
hEventsR = []; %initialize events handle
hEventsG = []; %initialize events handle
if ~isempty(ytempLeft) && ~isempty(ytempRight)
    plot(ytempCrop,'k'); hold on;
    for k = 1:length(myEvents)
        a = myEvents(k,1);
        c = myEvents(k,3);
        if myEventsFlag(k) == 1
            hEventsR = plot( a +limitsCrop(1)-1 : c +limitsCrop(1)-1 ,y1(a:c),'r');
        else
            hEventsG = plot( a +limitsCrop(1)-1 : c +limitsCrop(1)-1 ,y1(a:c),'g');
        end
    end
        plot(ytempLeft,'b');
        plot(ytempRight,'b');
        if ~isempty(hEventsG) && ~isempty(hEventsR)
            legend([hEventsG hEventsR],'Good Events','Bad Events');
        elseif isempty(hEventsR)
            legend(hEventsG,'Good Events')
        else
            legend(hEventsR,'Bad Events')
        end
else
    plot(y1,'k'); hold on;
    for k = 1:length(myEvents)
        a = myEvents(k,1);
        c = myEvents(k,3);
        if myEventsFlag(k) == 1
        hEventsR = plot(a:c, y1(a:c), 'r');
        else
        hEventsG = plot(a:c, y1(a:c), 'g');
        end
    end
        if ~isempty(hEventsG) && ~isempty(hEventsR)
            legend([hEventsG hEventsR],'Good Events','Bad Events');
        elseif isempty(hEventsR)
            legend(hEventsG,'Good Events')
        else
            legend(hEventsR,'Bad Events')
        end
end
hold off;
axis off;
% enable edit events
set(handles.pushbutton6,'Enable','on'); % EDIT EVENTS
% turn stats button on
set(handles.pushbutton8,'Enable','on'); %STATS
% turn save button off
set(handles.pushbutton9,'Enable','off'); %SAVE
% clear uitable1 data
set(handles.uitable1,'Data',[]); %set data array to empty


% ------------ Executes on button press in pushbutton4.
FILE CORRUPT. Skip analysis and documet file as bad
back to top------------
function pushbutton4_Callback(hObject, eventdata, handles)
% hObject    handle to pushbutton4 (see GCBO)
% eventdata  reserved - to be defined in a future version of MATLAB
% handles    structure with handles and user data (see GUIDATA)
cellname = evalin('base','cellname');
mydirChoose = evalin('base','mydirChoose');
fileCorrupt = 'File Corrupt'; %make string variable to store into stats data
assignin('base','fileCorrupt',fileCorrupt); %save to workspace and enter into stats data file
evalin('base',...
'save([cellname,''_'',''autoEventStats'', ''.mat''],''fileCorrupt'');');
% move statistics file to mydirChoose
movefile([cellname,'_','autoEventStats.mat'],mydirChoose);
% disable buttons
set(handles.pushbutton3,'Enable','off'); % THRESHOLD
set(handles.pushbutton8,'Enable','off'); % STATS
set(handles.pushbutton6,'Enable','off'); % EDIT EVENTS
set(handles.pushbutton9,'Enable','off'); % SAVE

% ----------- Executes on button press in pushbutton7.
OPEN FOLDER. Initialize dialog box. Open directory containing results from animal
back to top-----------
function pushbutton7_Callback(hObject, eventdata, handles)
% hObject    handle to pushbutton7 (see GCBO)
% eventdata  reserved - to be defined in a future version of MATLAB
% handles    structure with handles and user data (see GUIDATA)
%
% Get directory and save to workspace
mydirChoose = evalin('base','mydirChoose'); %get previously selected path
mydirChoose = uigetdir(mydirChoose); %get path to chosen directory
% if no folder selected return to gui
if mydirChoose == 0
    msgbox('Select a folder')
    return;
end
assignin('base','mydirChoose',mydirChoose); %save variable to workspace

% Clear variable from workspace
evalin('base','clear cellname limitsCrop mycell si y1 ytempCrop ytempLeft ytempRight myEvents myEventsFlag peakSet peakThreshold EventDataStats hfigStats');
% Fill static text box
parsemypath = strfind(mydirChoose,'\'); %get all indices where '\' exists
myfolder = mydirChoose(parsemypath(end)+1:end); %get all info after last '\'
set(handles.text4,'string',myfolder); %info after last '\' is folder name
% enable open file button
set(handles.pushbutton5,'Enable','on'); % OPEN FILE
% disable file corrupt, reset, crop, threshold, stats, edit events, save
set(handles.pushbutton4,'Enable','off'); % FILE CORRUPT
set(handles.pushbutton1,'Enable','off'); % RESET
set(handles.pushbutton2,'Enable','off'); % CROP
set(handles.pushbutton3,'Enable','off'); % THRESHOLD
set(handles.pushbutton8,'Enable','off'); % STATS
set(handles.pushbutton6,'Enable','off'); % EDIT EVENTS
set(handles.pushbutton9,'Enable','off'); % SAVE
% clear axes 1,2,3,4
cla(handles.axes1,'reset');
set(handles.axes1,'visible','off')
axis off;
cla(handles.axes2,'reset');
set(handles.axes2,'visible','off')
axis off;
cla(handles.axes3,'reset');
set(handles.axes3,'visible','off')
axis off;
cla(handles.axes4,'reset');
set(handles.axes4,'visible','off')
axis off;
% clear uitable1 data
set(handles.uitable1,'Data',[]); %set data array to empty
% clear text8, 9,  10
set(handles.text8,'string','#'); %Events
set(handles.text9,'string','#'); %Good Events
set(handles.text10,'string','#'); %Bad Events


% --------- Executes on button press in pushbutton5.
OPEN FILE. Initialized open dialog box and open a waveform data file with .abf
back to top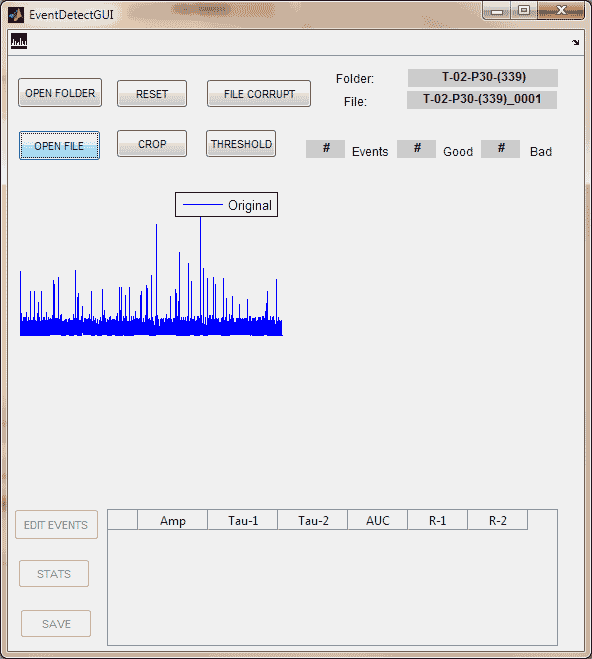
---------extension
function pushbutton5_Callback(hObject, eventdata, handles)
% hObject    handle to pushbutton5 (see GCBO)
% eventdata  reserved - to be defined in a future version of MATLAB
% handles    structure with handles and user data (see GUIDATA)
mydirChoose = evalin('base','mydirChoose');
myfile = uigetfile({'*.abf',  'Electrophysiology files (*.abf)'},...
    'Select Electrophys Raw Data File', [mydirChoose,'/']);
% if file not .abf exit function
if isempty(strfind(myfile,'.abf'))
    if myfile == 0
        msgbox('Select .abf file')
    end
    return;
end
% Clear variable from workspace
evalin('base','clear cellname limitsCrop mycell si y1 ytempCrop ytempLeft ytempRight myEvents myEventsFlag peakSet peakThreshold EventDataStats hfigStats');
% clear uitable1 data
set(handles.uitable1,'Data',[]); %set data array to empty
% get file information and save waveform
cellname = strtok(myfile,'.'); %get cell name without .abf, use "period" as delimeter
    assignin('base','cellname',cellname); %save variable to workspace
copyfile([mydirChoose,'\',myfile],myfile); %copy file to current directory
[cell1 si] = abfload(myfile);  %run directory specific function cell1 = waveform, si = sample interval
si = si/1e6; %convert sample interval from us to sec
    assignin('base','si',si);
mycell = myFilter(cell1); %filter signal
    assignin('base','mycell',mycell); %save to workspace
delete(myfile); %delete copied file from current directory
% plot the filtered waveform into axes1
axes(handles.axes1); %activate axes1
plot(mycell); legend('Original')
axis off
% Fill static text box
set(handles.text1,'string',cellname);
% initialize variables
y1 = mycell;
assignin('base','y1',y1);
ytempLeft = [];
assignin('base','ytempLeft',ytempLeft);
ytempRight = [];
assignin('base','ytempRight',ytempRight);
ytempCrop = [];
assignin('base','ytempCrop',ytempCrop);
limitsCrop = [];
assignin('base','limitsCrop',limitsCrop);
% clear axes 2,3,4
cla(handles.axes2,'reset');
set(handles.axes2,'visible','off')
axis off;
cla(handles.axes3,'reset');
set(handles.axes3,'visible','off')
axis off;
cla(handles.axes4,'reset');
set(handles.axes4,'visible','off')
axis off;
% enable buttons: file corrupt, reset, crop, threshold
set(handles.pushbutton4,'Enable','on'); % FILE CORRUPT
set(handles.pushbutton1,'Enable','on'); % RESET
set(handles.pushbutton2,'Enable','on'); % CROP
set(handles.pushbutton3,'Enable','on'); % THRESHOLD
% disable buttons: stats, editevents, save
set(handles.pushbutton8,'Enable','off'); % STATS
set(handles.pushbutton6,'Enable','off'); % EDIT EVENTS
set(handles.pushbutton9,'Enable','off'); % SAVE
% clear text8, 9,  10
set(handles.text8,'string','#'); %Events
set(handles.text9,'string','#'); %Good Events
set(handles.text10,'string','#'); %Bad Events

% Check if file already analyzed
mydirList = dir(mydirChoose); % save all files in search folder
for k = 1:length(mydirList) % iterate through all fils in search folder
    tempString = mydirList(k).name; %assign file name to temp string
    if ~isempty(strfind(tempString, cellname)) && ~isempty(strfind(tempString, '.mat')); %if file matches cellname and has .mat extension
        errordlg('File Previously Analyzed', 'File Warning') % display error warning
    end
end


% ------------ Executes on button press in pushbutton6.
EDIT EVENTS. Open new gui to edit even detection
back to top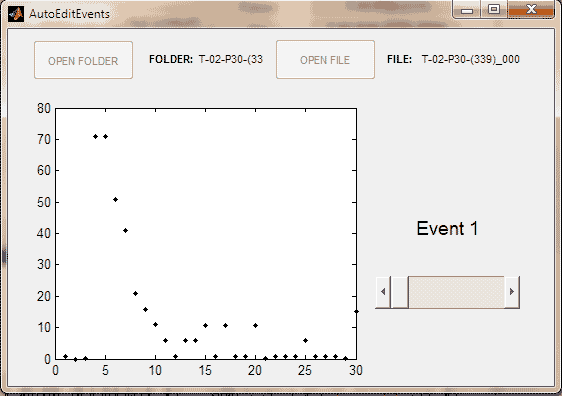
------------
function pushbutton6_Callback(hObject, eventdata, handles)
% hObject    handle to pushbutton6 (see GCBO)
% eventdata  reserved - to be defined in a future version of MATLAB
% handles    structure with handles and user data (see GUIDATA)
%
% Call autoeditevents gui
AutoEditEvents; % get handle to gui


% ----- Executes on button press in pushbutton8.
STATS. Generate Event Stats
back to top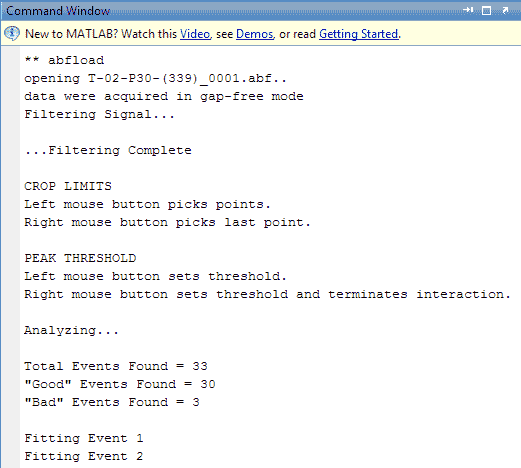
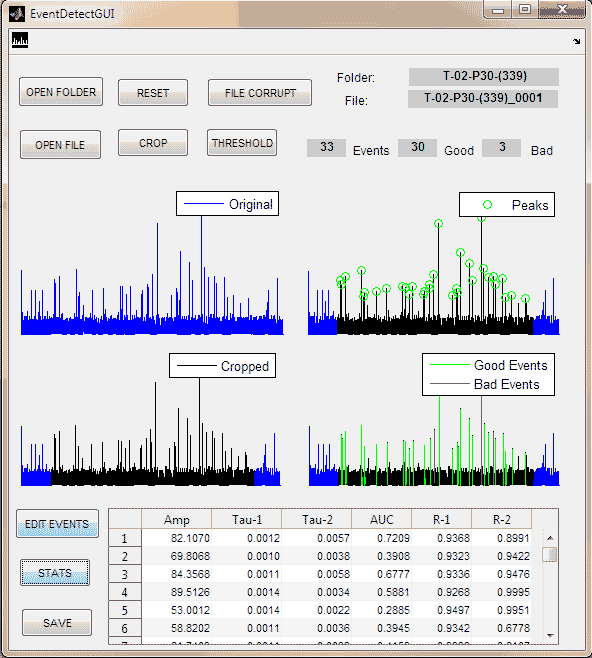
-----
function pushbutton8_Callback(hObject, eventdata, handles)
% hObject    handle to pushbutton8 (see GCBO)
% eventdata  reserved - to be defined in a future version of MATLAB
% handles    structure with handles and user data (see GUIDATA)
myEvents = evalin('base','myEvents');
y1 = evalin('base','y1');
myEventsFlag = evalin('base','myEventsFlag');
si = evalin('base','si');
[EventDataStats hfigStats] = getEventStats(myEvents,y1,myEventsFlag,si);
if ~isempty(hfigStats)
    for k = 1:numel(hfigStats) % iterate through number of elements in hfigStats
        if hfigStats(k) ~= 0 %if entry not equal to zero then figure exists, close
            close(hfigStats(k))
        end
    end
end
assignin('base','EventDataStats',EventDataStats);
assignin('base','hfigStats',hfigStats);
% enter statistics into the uitable1
set(handles.uitable1,'Data',EventDataStats);
% activate save button
set(handles.pushbutton9,'Enable','on')


% ---- Executes on button press in pushbutton9.
SAVE. Saves event statistics to a .mat file
back to top----
function pushbutton9_Callback(hObject, eventdata, handles)
% hObject    handle to pushbutton9 (see GCBO)
% eventdata  reserved - to be defined in a future version of MATLAB
% handles    structure with handles and user data (see GUIDATA)
cellname = evalin('base','cellname');
mydirChoose = evalin('base','mydirChoose');
mydirList = dir(mydirChoose);
for k = 1:length(mydirList)
    tempString = mydirList(k).name;
    if ~isempty(strfind(tempString, cellname)) && ~isempty(strfind(tempString, '.mat'));
        overwriteFile = questdlg('Overwrite File','File Warning',...
            'yes','no','cancel','cancel');
        if strcmp(overwriteFile,'no') || strcmp(overwriteFile,'cancel') % do not overwrite file
        break; % stop search
        else % overwrite file
            evalin('base',...
            'save([cellname,''_'',''autoEventStats'', ''.mat''],''EventDataStats'', ''limitsCrop'', ''myEvents'',''myEventsFlag'', ''peakSet'', ''peakThreshold'', ''si'');');
            % move statistics file to mydirChoose
            movefile([cellname,'_','autoEventStats.mat'],mydirChoose); %move Stats file to search folder
            msgbox('File Saved','EventStats','help'); %display confirmation message in window
        break; % stop search
        end
    elseif k == length(mydirList) % file does not exist, save
        evalin('base',...
        'save([cellname,''_'',''autoEventStats'', ''.mat''],''EventDataStats'', ''limitsCrop'', ''myEvents'',''myEventsFlag'', ''peakSet'', ''peakThreshold'', ''si'');');
        % move statistics file to mydirChoose
        movefile([cellname,'_','autoEventStats.mat'],mydirChoose); % move Stats file to search folder
        msgbox('File Saved','EventStats','help'); %display confirmation message in window
    end
end


% ---- Executes on button press in plot_tool.
PLOT. Saves record to a .pdf file
back to top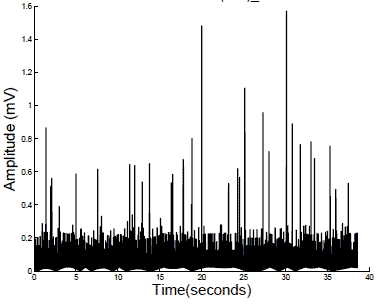
---- --------------------------------------------------------------------
function plot_tool_ClickedCallback(hObject, eventdata, handles)
% hObject handle to plot_tool (see GCBO)
% eventdata reserved - to be defined in a future version of MATLAB
% handles structure with handles and user data (see GUIDATA)
% Load variables
y1 = evalin('base','y1');
si = evalin('base','si');
% plot the cropped waveform with padded edges where cropped
mydirChoose = evalin('base','mydirChoose');
myfile = evalin('base','cellname');
myabf = [mydirChoose,'/',myfile, '.abf']; %run directory specific function cell1 = waveform, si = sample interval
% Search the file for the Gain information
fid = fopen(myabf,'r','ieee-le'); %open the abf file, readonly, machine format
sz=1; %# of data entries to read
numType = 'float'; %precision format
myGainfileoffset = 268; %find the correct offset where data entry for gain begins
fseek(fid,myGainfileoffset,'bof'); %move field position
cellGain = fread(fid,sz,numType); %read formatted data
fclose(fid); %close file
% Correct y1 by gain factor
y1 = y1/cellGain;
% Generate time series x-axis
x1 = (1:length(y1))*si; %get x-vector in time units
% Check file path for MEP, MEPPs or EPC, EPCs
analysisfilePath = evalin('base','mydirChoose'); %get file path for analysis file
recordType = regexp(analysisfilePath, '(MEP|MEPPs|EPC|EPCs)', 'match');
recordType = char(recordType);
% Determine Units based on record type
if strcmp(recordType, 'MEP') || strcmp(recordType, 'MEPPs')
unitsY = 'mV';
else
unitsY = 'nA';
end
% Get save location
% Select Folder
mydircheck = evalin('base','exist(''mydirSave'',''var'');');
if mydircheck == 0
mydirSave = pwd;
else
mydirSave = evalin('base','mydirSave'); %get previously selected path
end
% Get folder path
mydirSave = uigetdir(mydirSave); %get path to chosen directory
% if no folder selected return to gui
if mydirSave == 0
msgbox('Select a folder')
return;
end
% Modify fileName for printing
myfilePrint = regexprep(myfile,'_','\\_');
AxisFont = 18;
% Plot Data
hf_curve = figure; ha_curve = axes; plot(x1,y1,'k','LineWidth',2); set(gca,'Box','off');
title({[recordType,' ', myfilePrint]},'FontSize', AxisFont);
xlabel('Time(seconds)','FontSize',20) %x-axis label
ylabel(['Amplitude (', unitsY, ')'], 'FontSize',20) %y-axis label
saveas(gcf,[mydirSave, '\', recordType, '_', myfile, '_', 'Trace', '.pdf'], 'pdf');
close gcf;